CASE STUDIES
PracticePal Case Study
Responsive dashboard solution for a niche medical field in the optometry industry
Background
When individuals experience vision problems, they visit a care provider to diagnose and treat these abnormalities with some form of corrective lenses.
The end-to-end journey to provide this level of care to individuals involves a number of professionals, physicians and coordinators to fulfill the corrective procedures or equipment.
This journey requires close collaboration between optometrists, opticians, physicians, schedulers, and insurance providers.
In the current state, this process and means of collaboration is full of friction that is slow and ripe for error. The industry is in desperate need for tools and processes that improve the speed, accuracy and experience for not just the individuals seeking vision correction, but also the individuals providing care.
Problem
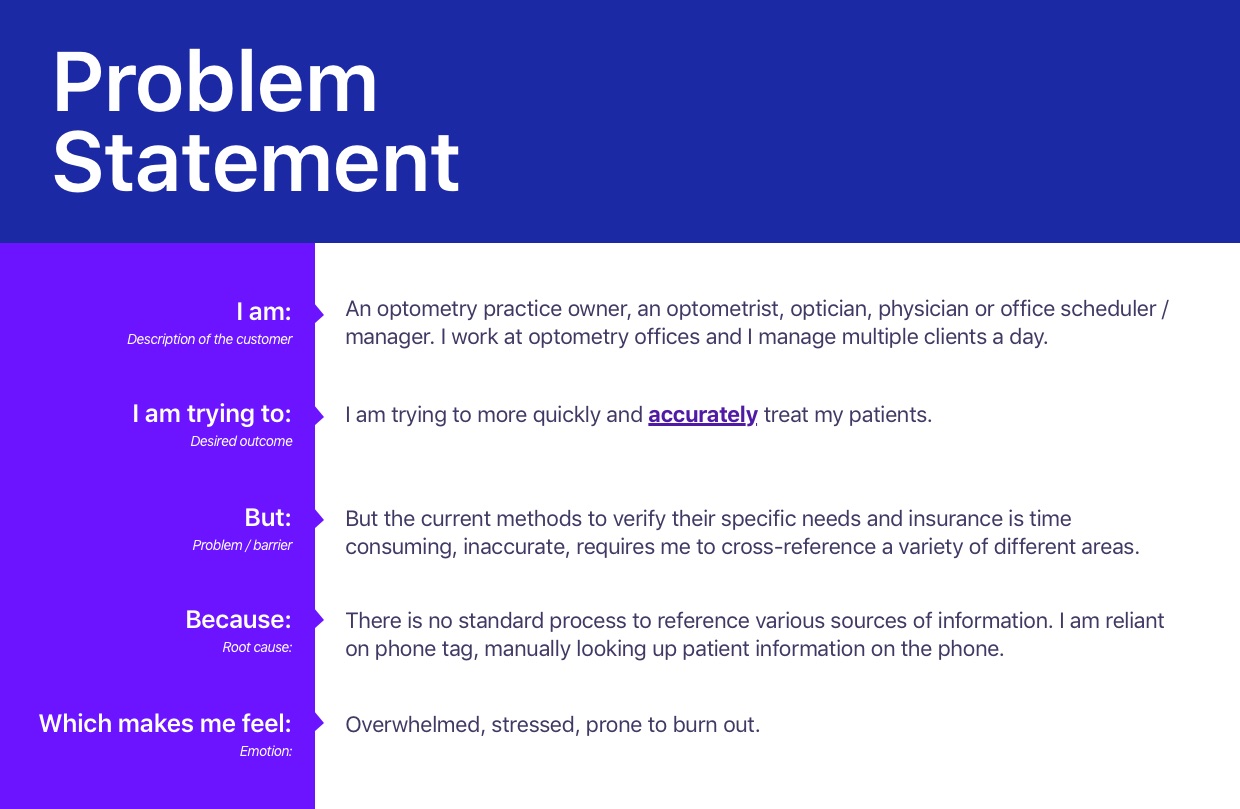
The friction involved in the eye care journey outlined above lacks necessary tools to improve communication, collaboration and accuracy when treating patients.
Daily eye care practice operations are time-consuming and expensive due to constant confusion around insurance eligibility, copay amounts, and vendor portal credentials.
Staff members schedule appointments without verifying vision insurance and then spend countless hours a month checking vision care plan portals to find eligibility and copay information for patients, ultimately having to painstakingly decipher plan details to manually calculate the copays. These primary pain points all translate to lost profits from a lack of accuracy and speed treating patients.
Solution
Faster, better and more accurate care for patients
The opticians, optometrists, office schedulers, administration assistants and practice owners require better tools to align the various areas of practice that are involved in providing corrective eye care. The solution aims to provide faster, better and more accurate care for patients. The current tools used to provide this care create confusion, security vulnerabilities and error.
Using a web-based, mobile responsive all-in-one dashboard solution, our goal is to provide a comprehensive tool that will allow practice owners and contributors to manage all the activities at their practice.
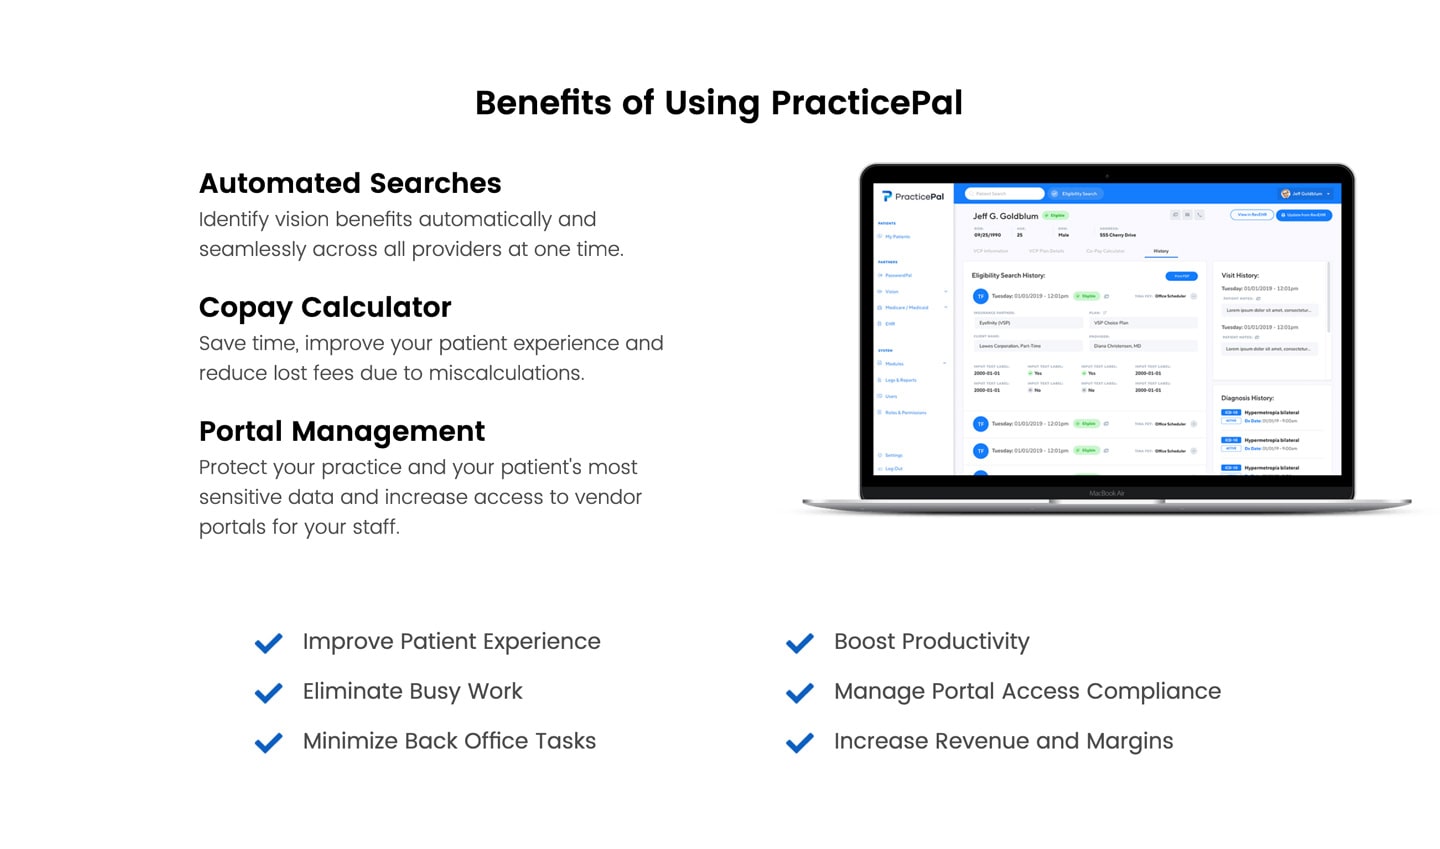
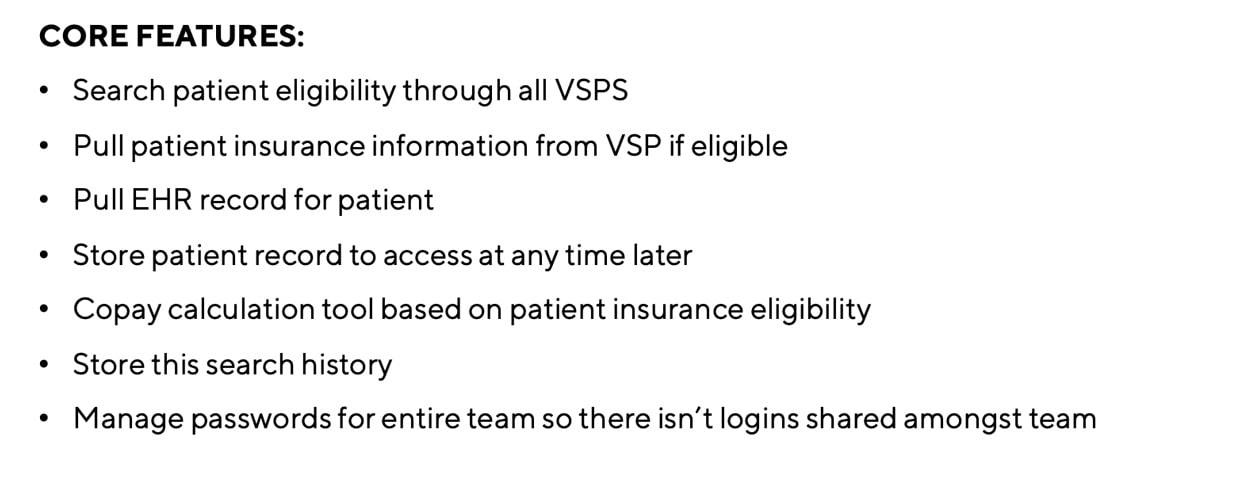
The dashboard will include:
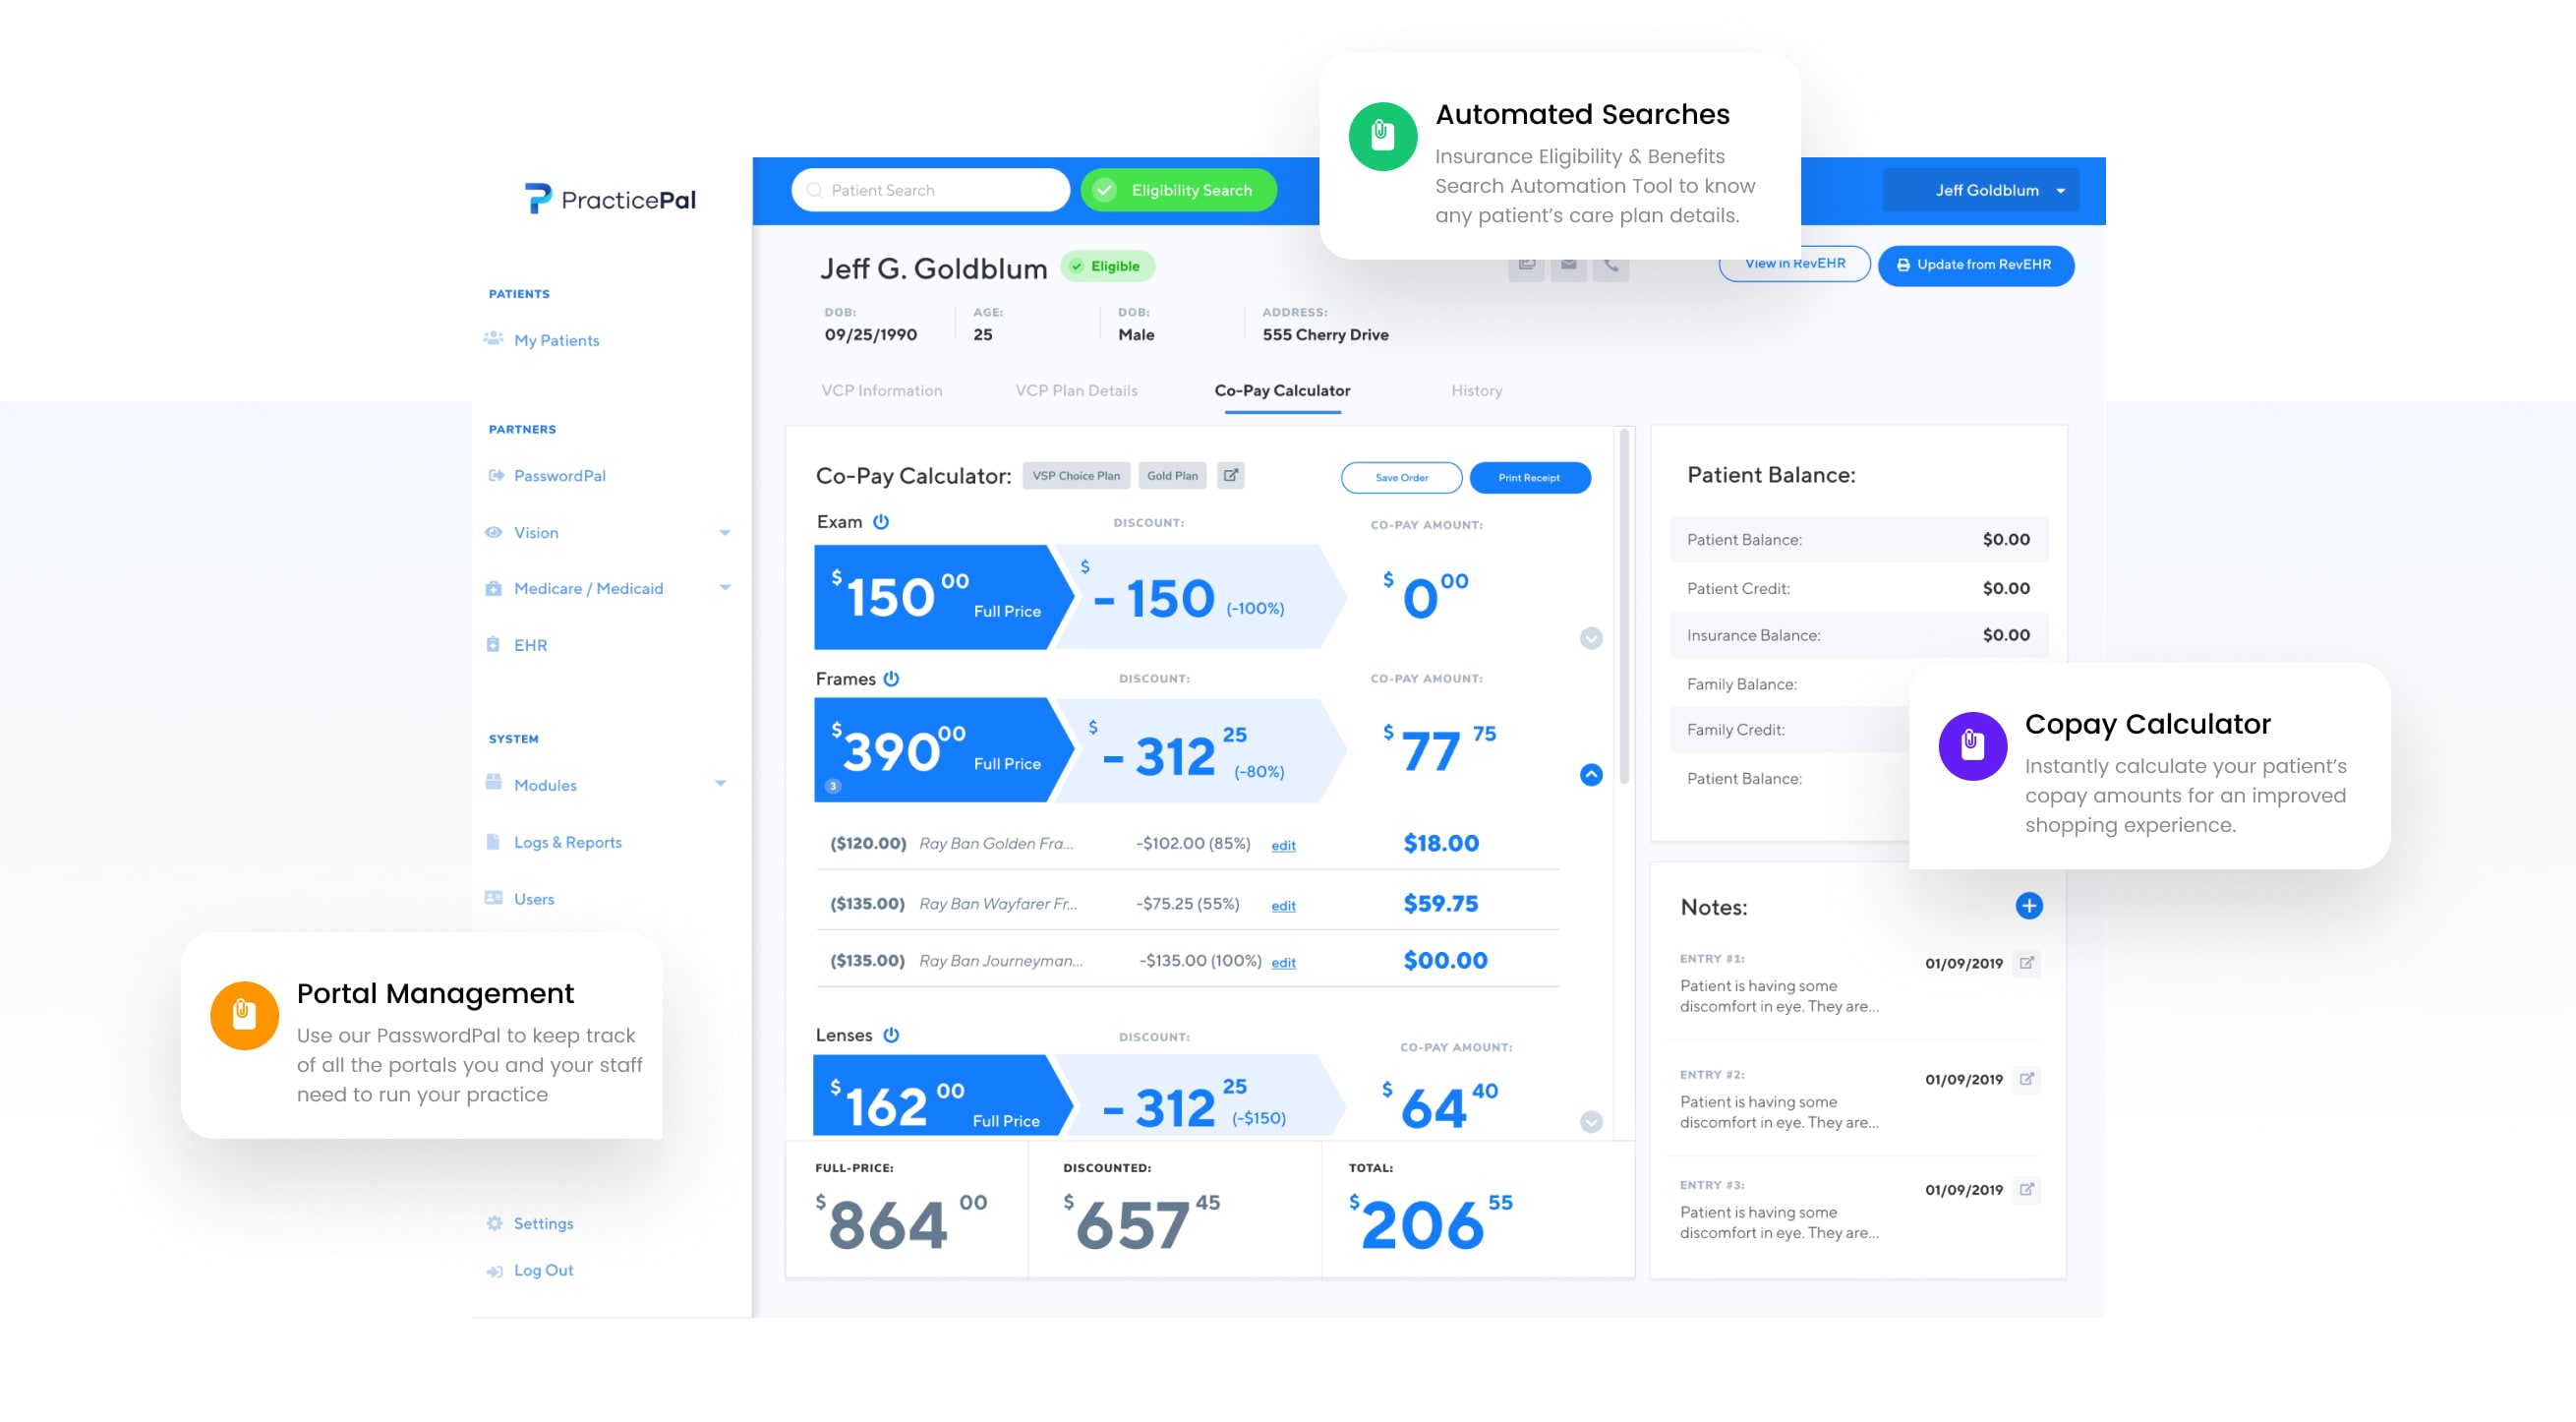
- Vision Insurance Search - Verify whether patients are covered by their insurance before you treat. Comprehensive patient insurance eligibility and benefits automation.
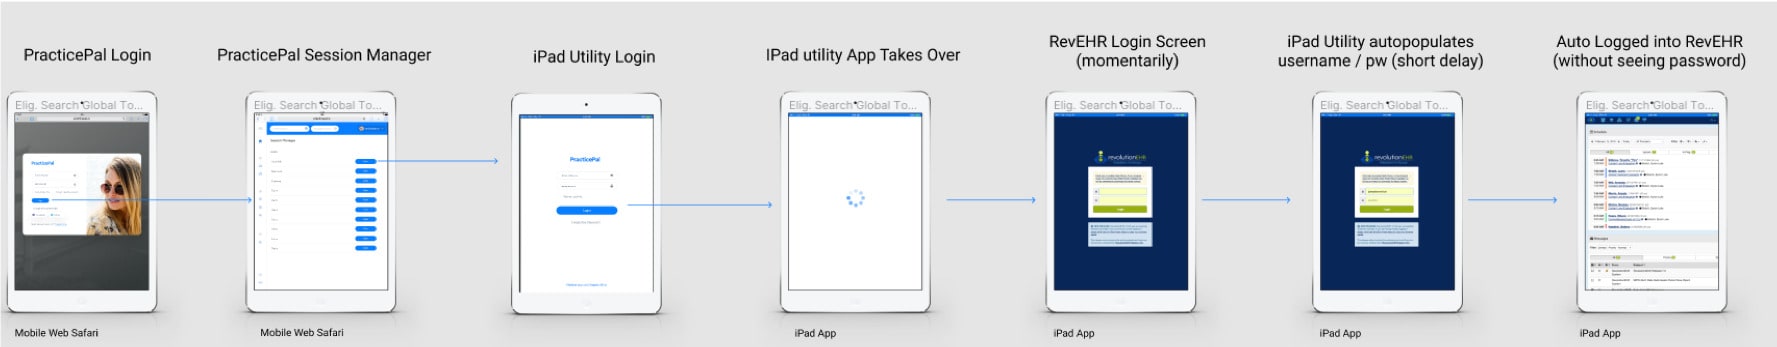
- PasswordPal - Protect confidential patient and practice information by streamlining credential management amongst team members
- Copay calculator - Improve patient experience with real-time copay calculation, reducing confusion wait times and error.
My contribution
Lead Product Designer / Secondary Product Manager
As the Lead Product Designer on the project, I distilled a variety of existing research that the team had conducted prior to me joining the project, planned and mapped the overall user experience from the ground up. Using this planning and definition, I also built the user interface and defined how users would interact with the software.
In addition to the UX and UI, I conducted the market research, defined the marketing and brand strategy, built wireframes, prototypes, high-fidelity designs and interactive prototypes.
I also acted as a secondary product manager on the project, working with our lead PM to facilitate and communicate the development of the project, create user stories, implement agile / scrum processes throughout the team and communicate requirements to the development team.
Our approach
UX Methods
Empathize / Define
- Interviews
- Journey Mapping
- Personas
- Affinity Mapping
- Feature Prioritization
- Market Research
Ideation
- Sketching / Lo-fi prototypes
- User Feedback Analysis
- Information Architecture
- Card Sorting Feature Set
- Affinity Mapping
- Wireframing / Prototyping Solutions
Prototype / Test / Ideate
- Moderated Usability Testing
- Questionnaires
- Interviews
- Observation
Research
Interviews
Much of the requirement gathering and user research had been well underway prior to me joining the project. As a team, we relied on our stakeholders to elaborate on the problem they were facing and how my team could build a solution to solve that problem. We worked closely with the client to gather and distill feedback to determine the best possible solution to the problem they were facing.
Considering the territory and lack of market data in this niche medical field, we had to rely on a lot of assumption gathering and validation using a number of Lean UX methodologies.
Our team had conducted a number of user interviews to determine the best way to solve the problems outlined in our problem statement. Unlike most products I have worked on, competitive research can usually tell you about the market and user needs. Unfortunately, there wasn’t much direct competition we could sample to give us a sense of the best direction. The closest thing we have found was Electronic Health Record (EHR) software.
During initial requirement gathering, we had initially thought that our tool could be a useful alternative to current EHR software. During our interviews, we determined that we did not have the capital, time or run way to build an effective EHR alternative. We also understood that legal requirements outlined that patients information and health recordings should be capture in an EHR by law. Since a number of these practices already have successful systems that capture this information.
Working off of this discovery, we determined that we could closely integrate with a number of EHRs that practices use to manage client information, potentially partnering with them in the future to not replace tools that users were already using, but to supplement the current tools available.
We understood the market adoption with this solution would be easier. In the UX space, we are adamant to replace tools and provide the best possible software to our users but sometimes this isn’t the best approach. I learned that sometimes it is best to take baby steps to introduce change to your users rather than shifting everything on its head and introduce incremental change.
Journey Mapping
Identify Where the solution fits / emphasize with the customer
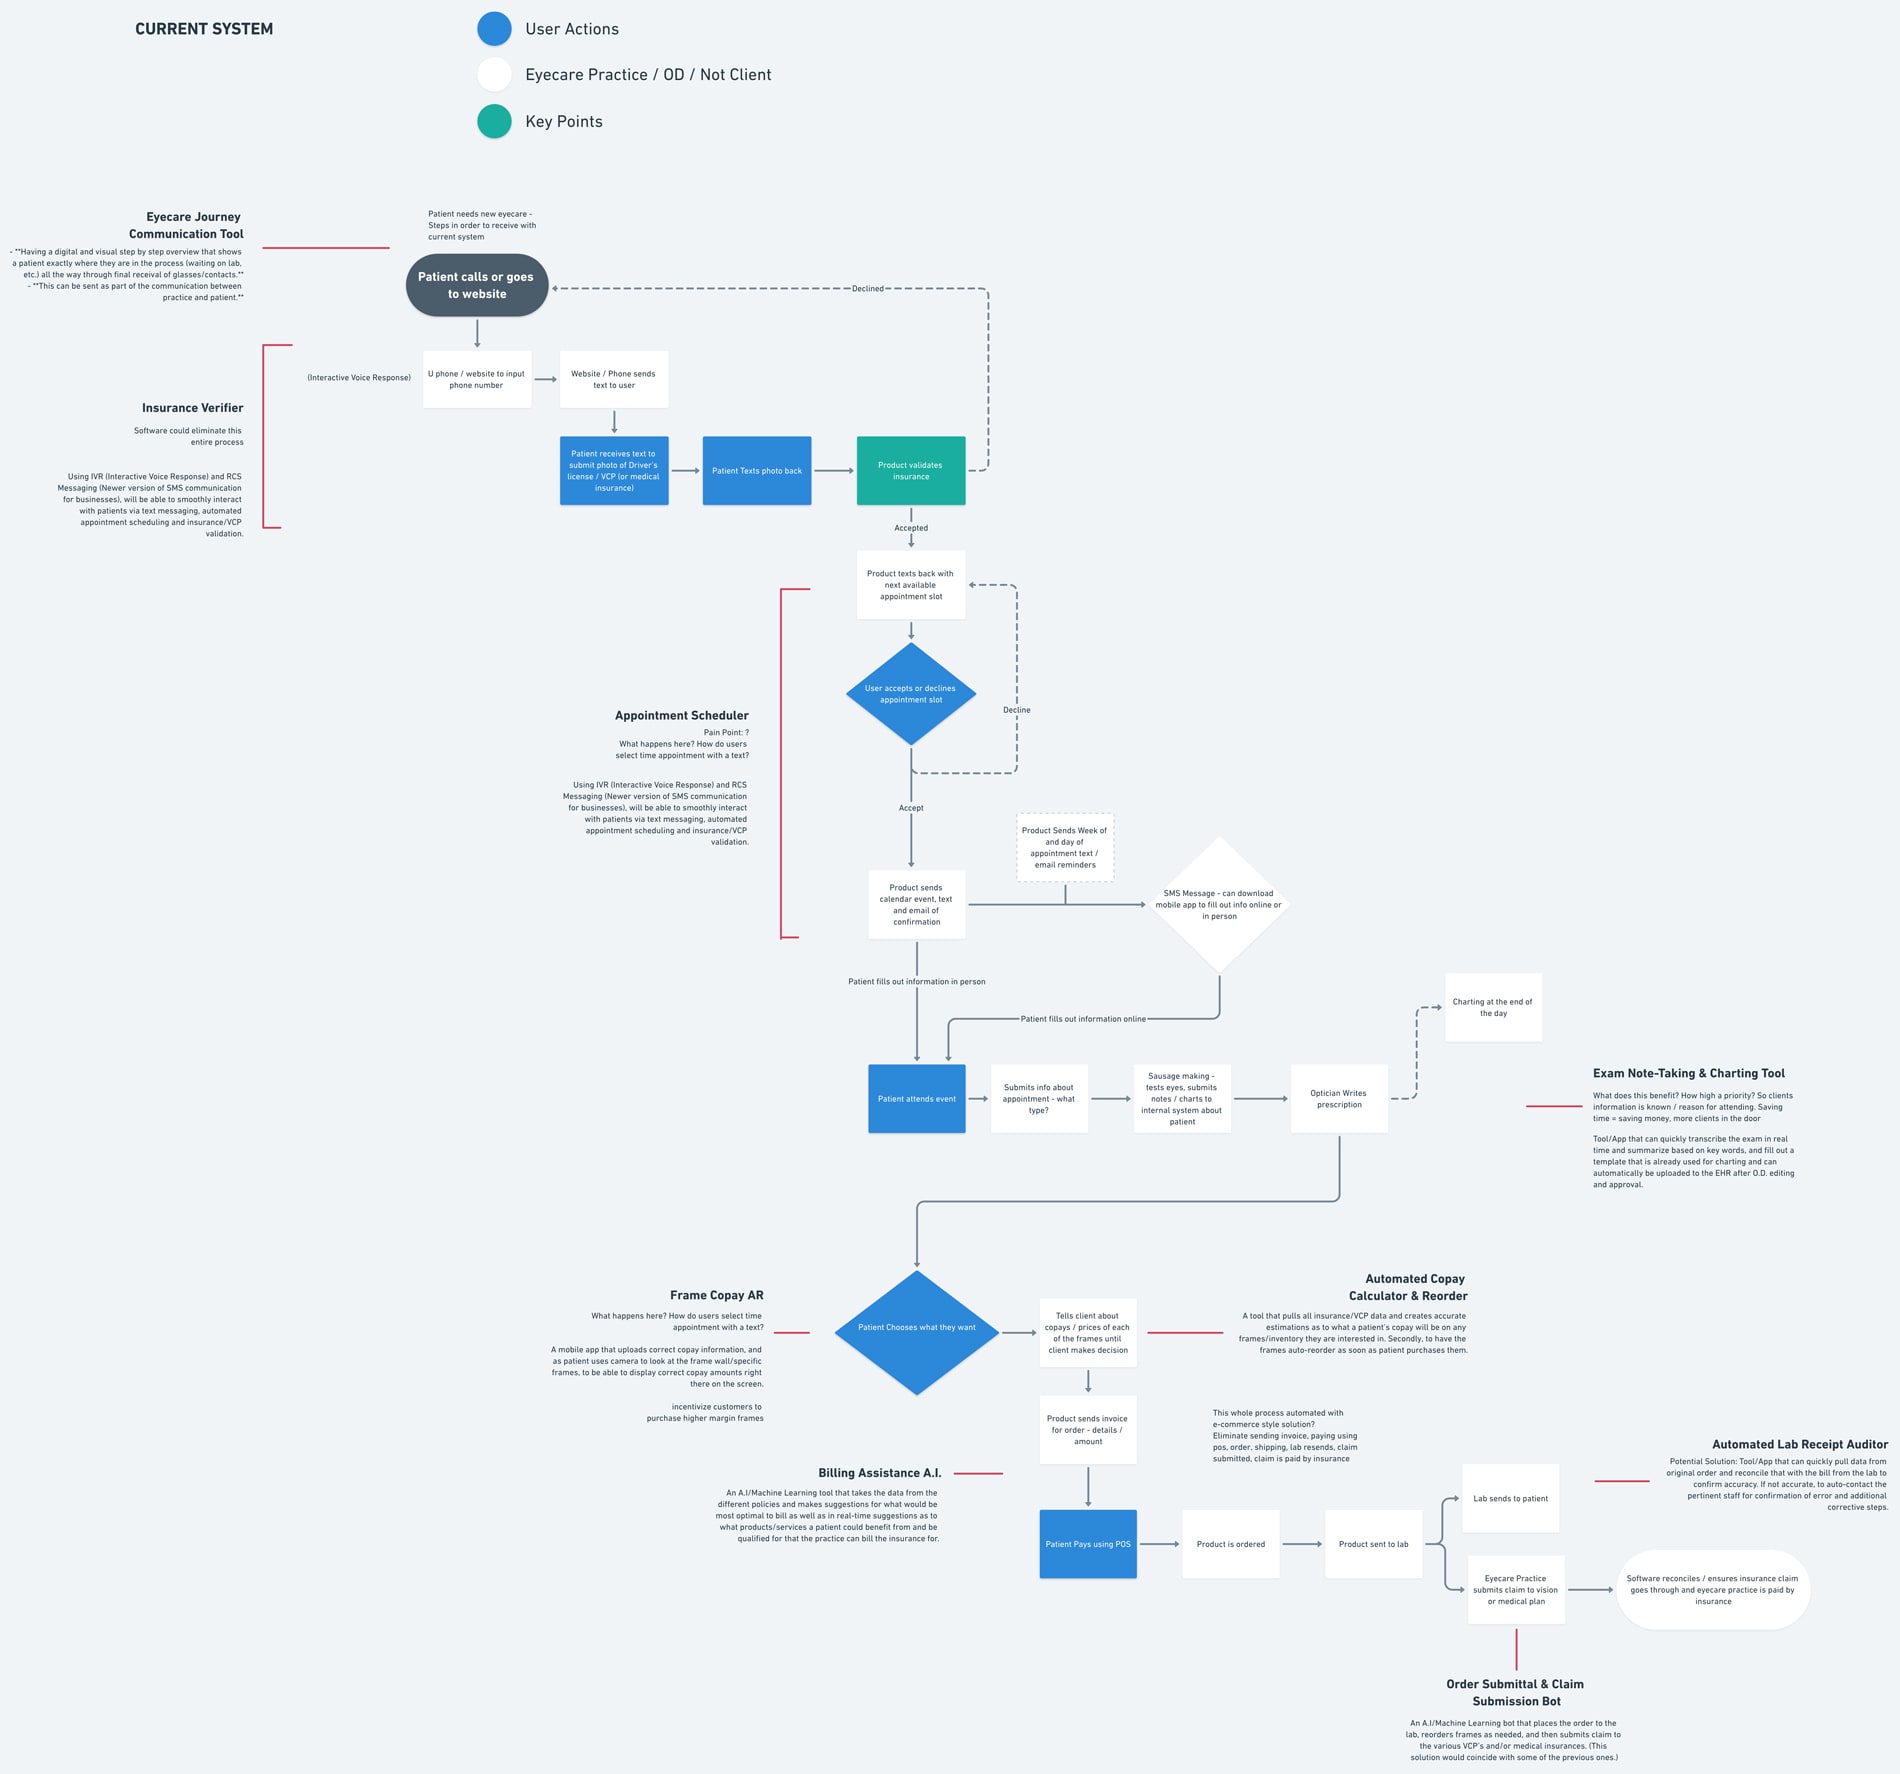
To better understand the pain points and customer journey, we built out a detailed customer journey flow to identify the areas we would address in our proposed solution. This journey outlined what would soon to be our initial feature offering. We ran this by our stakeholders to understand if this was an accurate way to look at the current problem areas and how it could influence our solution.
The specific areas where they pain points are most prevalent are in the following areas:
- Verifying insurance
- Scheduling appointments
- Billing Assistance
- Exam note-taking and charting
- Copay calculations and inventory management
- Insurance Submittal and claim submission
- Sharing Login credentials between team members / staying HIPAA compliant
- Transparency / communication throughout the process
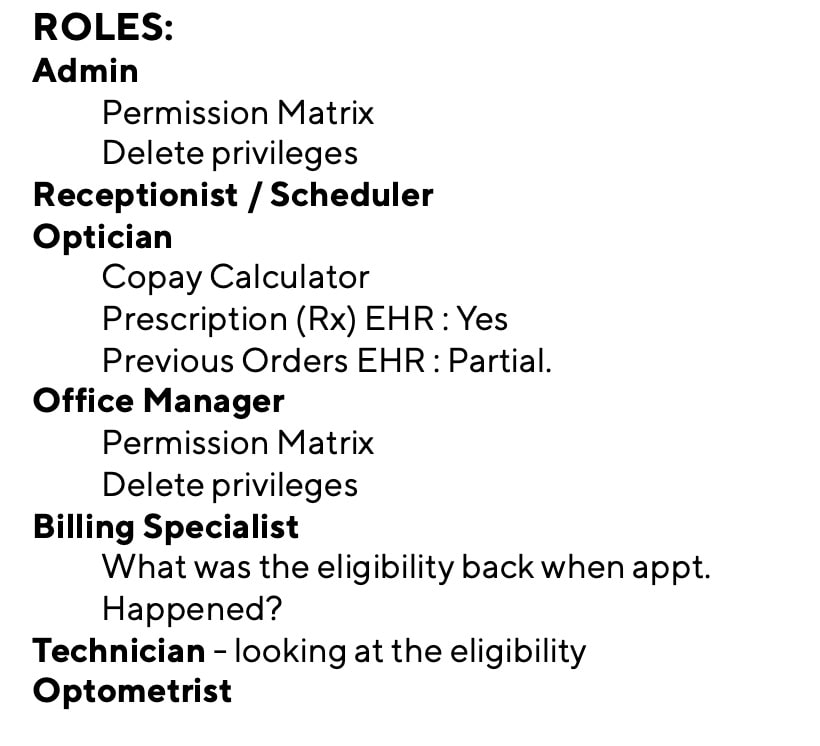
Persona development
Understanding the customer / user
Since all of the potential users work together in the same office and will be using the same software, it is important that we meet each of their needs when providing this tool. Using the personas we developed in these areas, mapping to our user research, we again worked closely with our stakeholders to best understand the problems that each of these individuals face in their day-to-day jobs.
The specific users that experience these problems are
- Admins
- Receptionist / Schedulers
- Opticians
- Office Managers
- Billing Specialist
- Technicians
- Optometrists
Each user has a specific set of problems so we began to map each of the problem areas to each persona. We combined the potential solutions we outlined into a core feature list that we be used to define our MVP product.
Each user has a specific set of problems so we began to map each of the problem areas to each persona. We combined the potential solutions we outlined into a core feature list that we be used to define our MVP product.
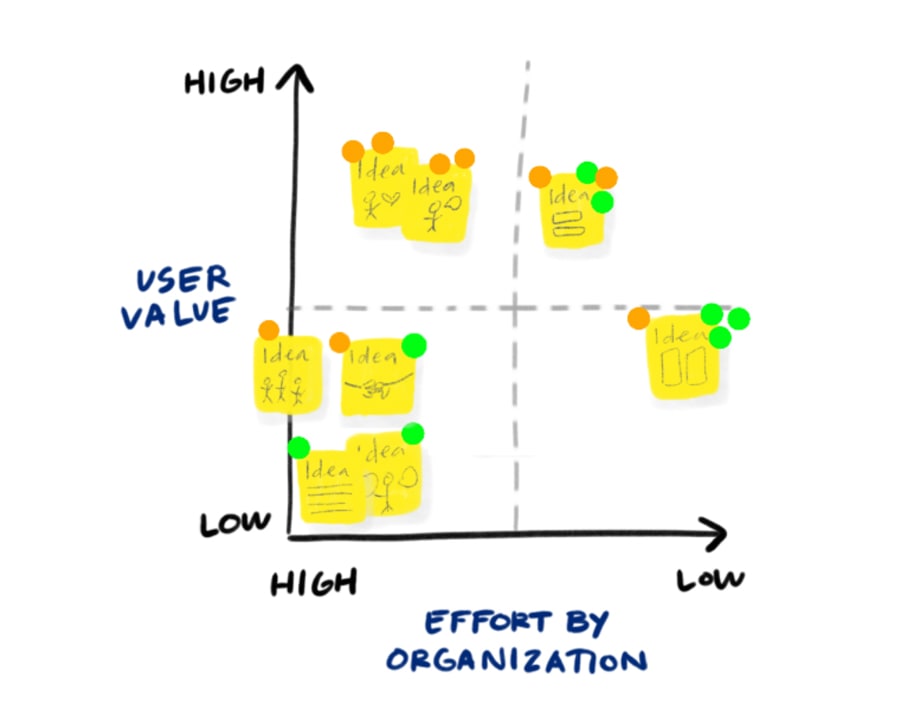
affinity mapping
Prioritizing what problems we solve
We used the problems and user personas to begin to categorize the problems and group them together to begin to distill what solutions and screens we would need to create and design. This categorization helped to inform the future information architecture and how we were to organize the complex nature of the application, and how each user would navigate through the application in a clear and delightful way.
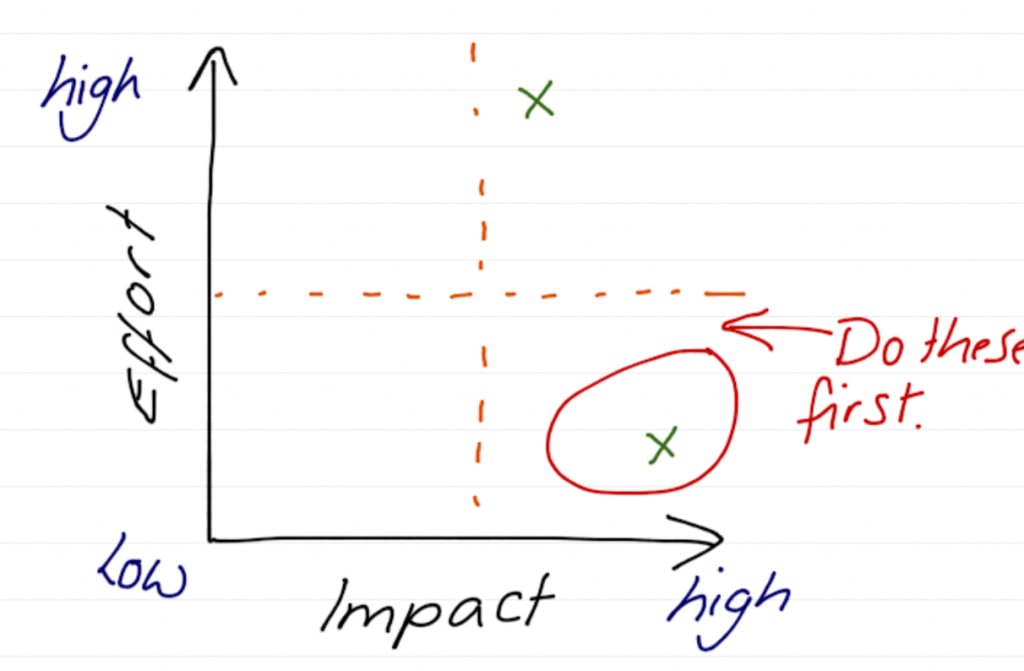
We took our learnings from our journey mapping, interviews, personas and discovery sessions to determine what we would work on in this initial MVP vs. later. We used the typical approach of mapping impact vs effort. This helped to determine how we could create the most possible impact before going to market, with this lowest barrier to entry, in this case time and cost.

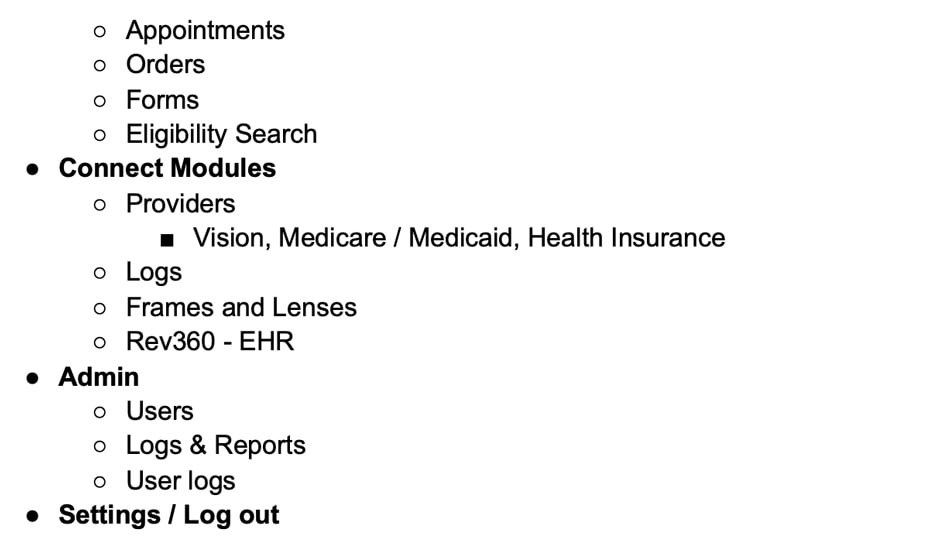
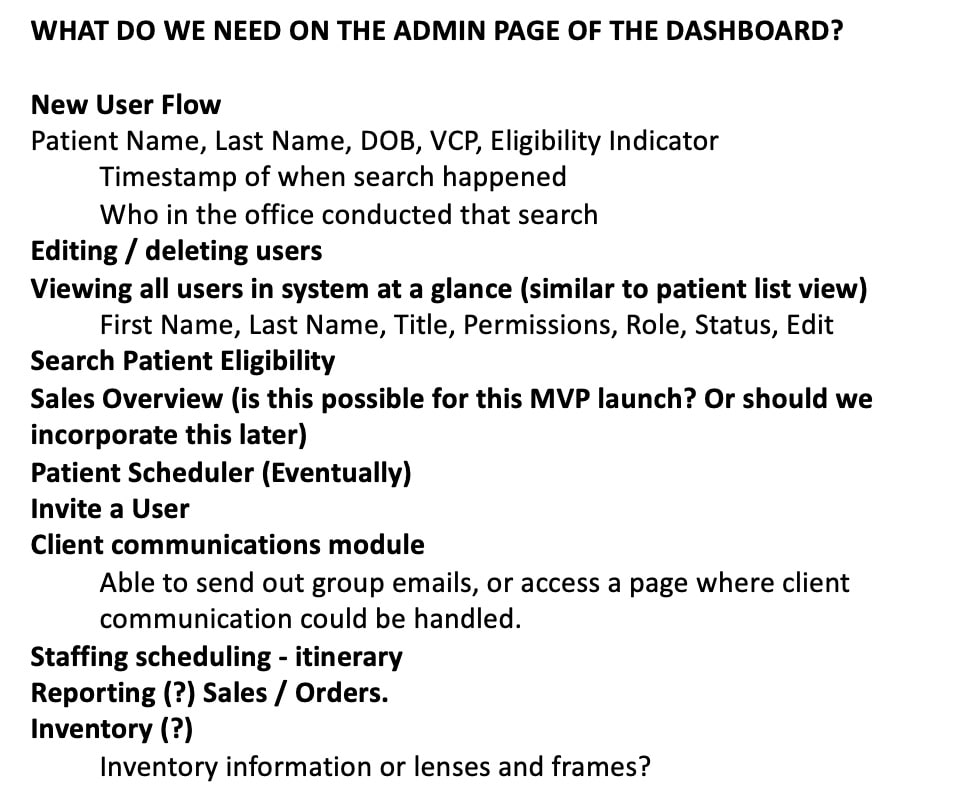
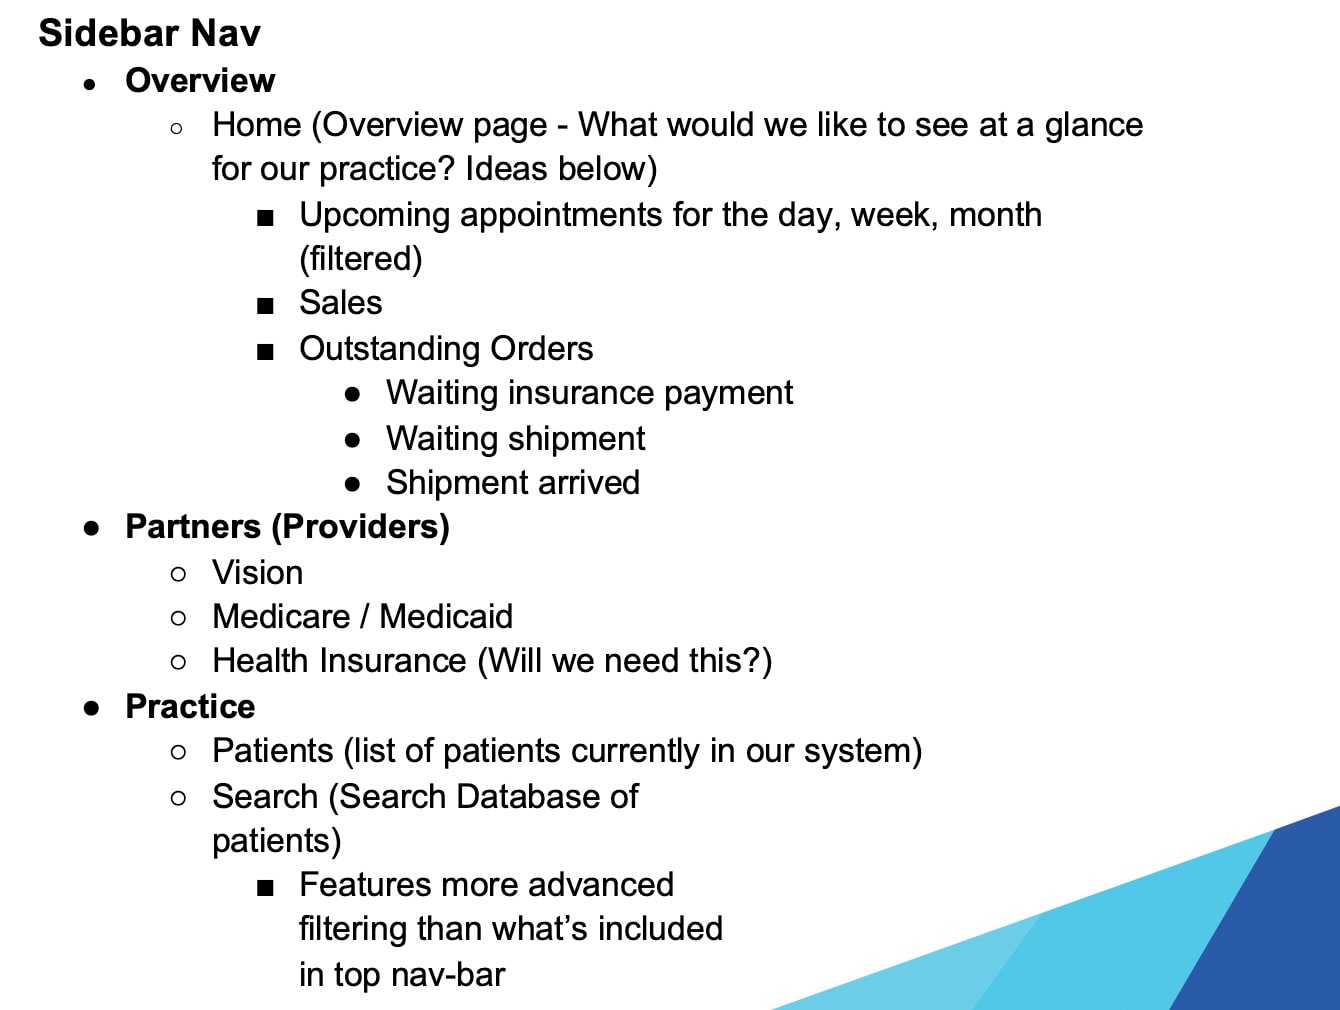
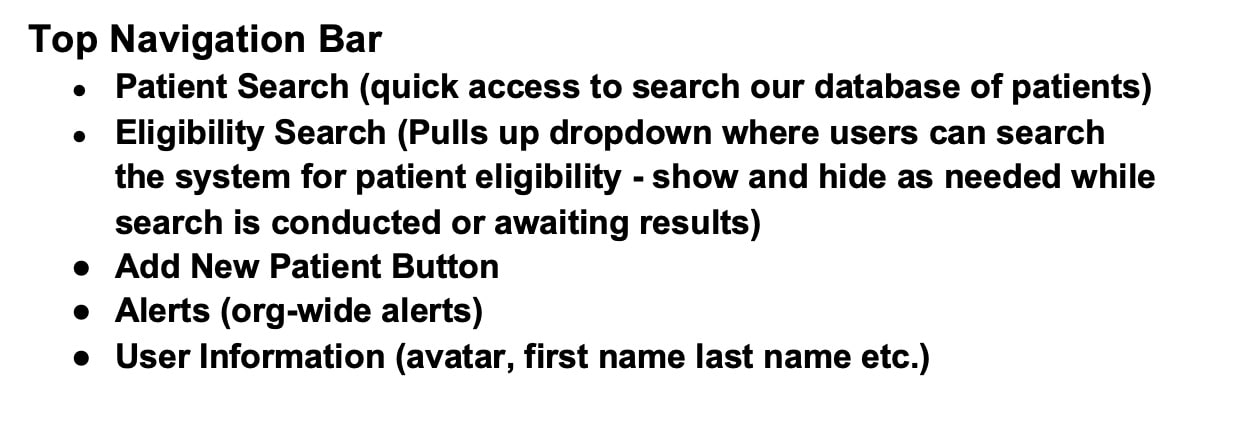
Information Architecture
Underlying organization and structure
The challenging part about the dashboard we were building is how we were to provide the means for a variety of different users to effectively view a very dense amount of information clear and concisely. The data was to be easily presented, with a clear hierarchy that doesn’t just solve the needs of one persona, but for all.
We quickly determined this approach might be more than challenging. We met with our CTO and proposed that our dashboard could be modular, and specific to each login credential by user type, meaning that depending on your user role, you would see variations of a modular design system, specific to your area of expertise. Permissions on what each individual user role could see could be customized by the owner of the practice.
Once we determined how the information was going to be organized, we began thinking about the navigation and how users would arrive at the data.
Putting everything together with exploration
Design
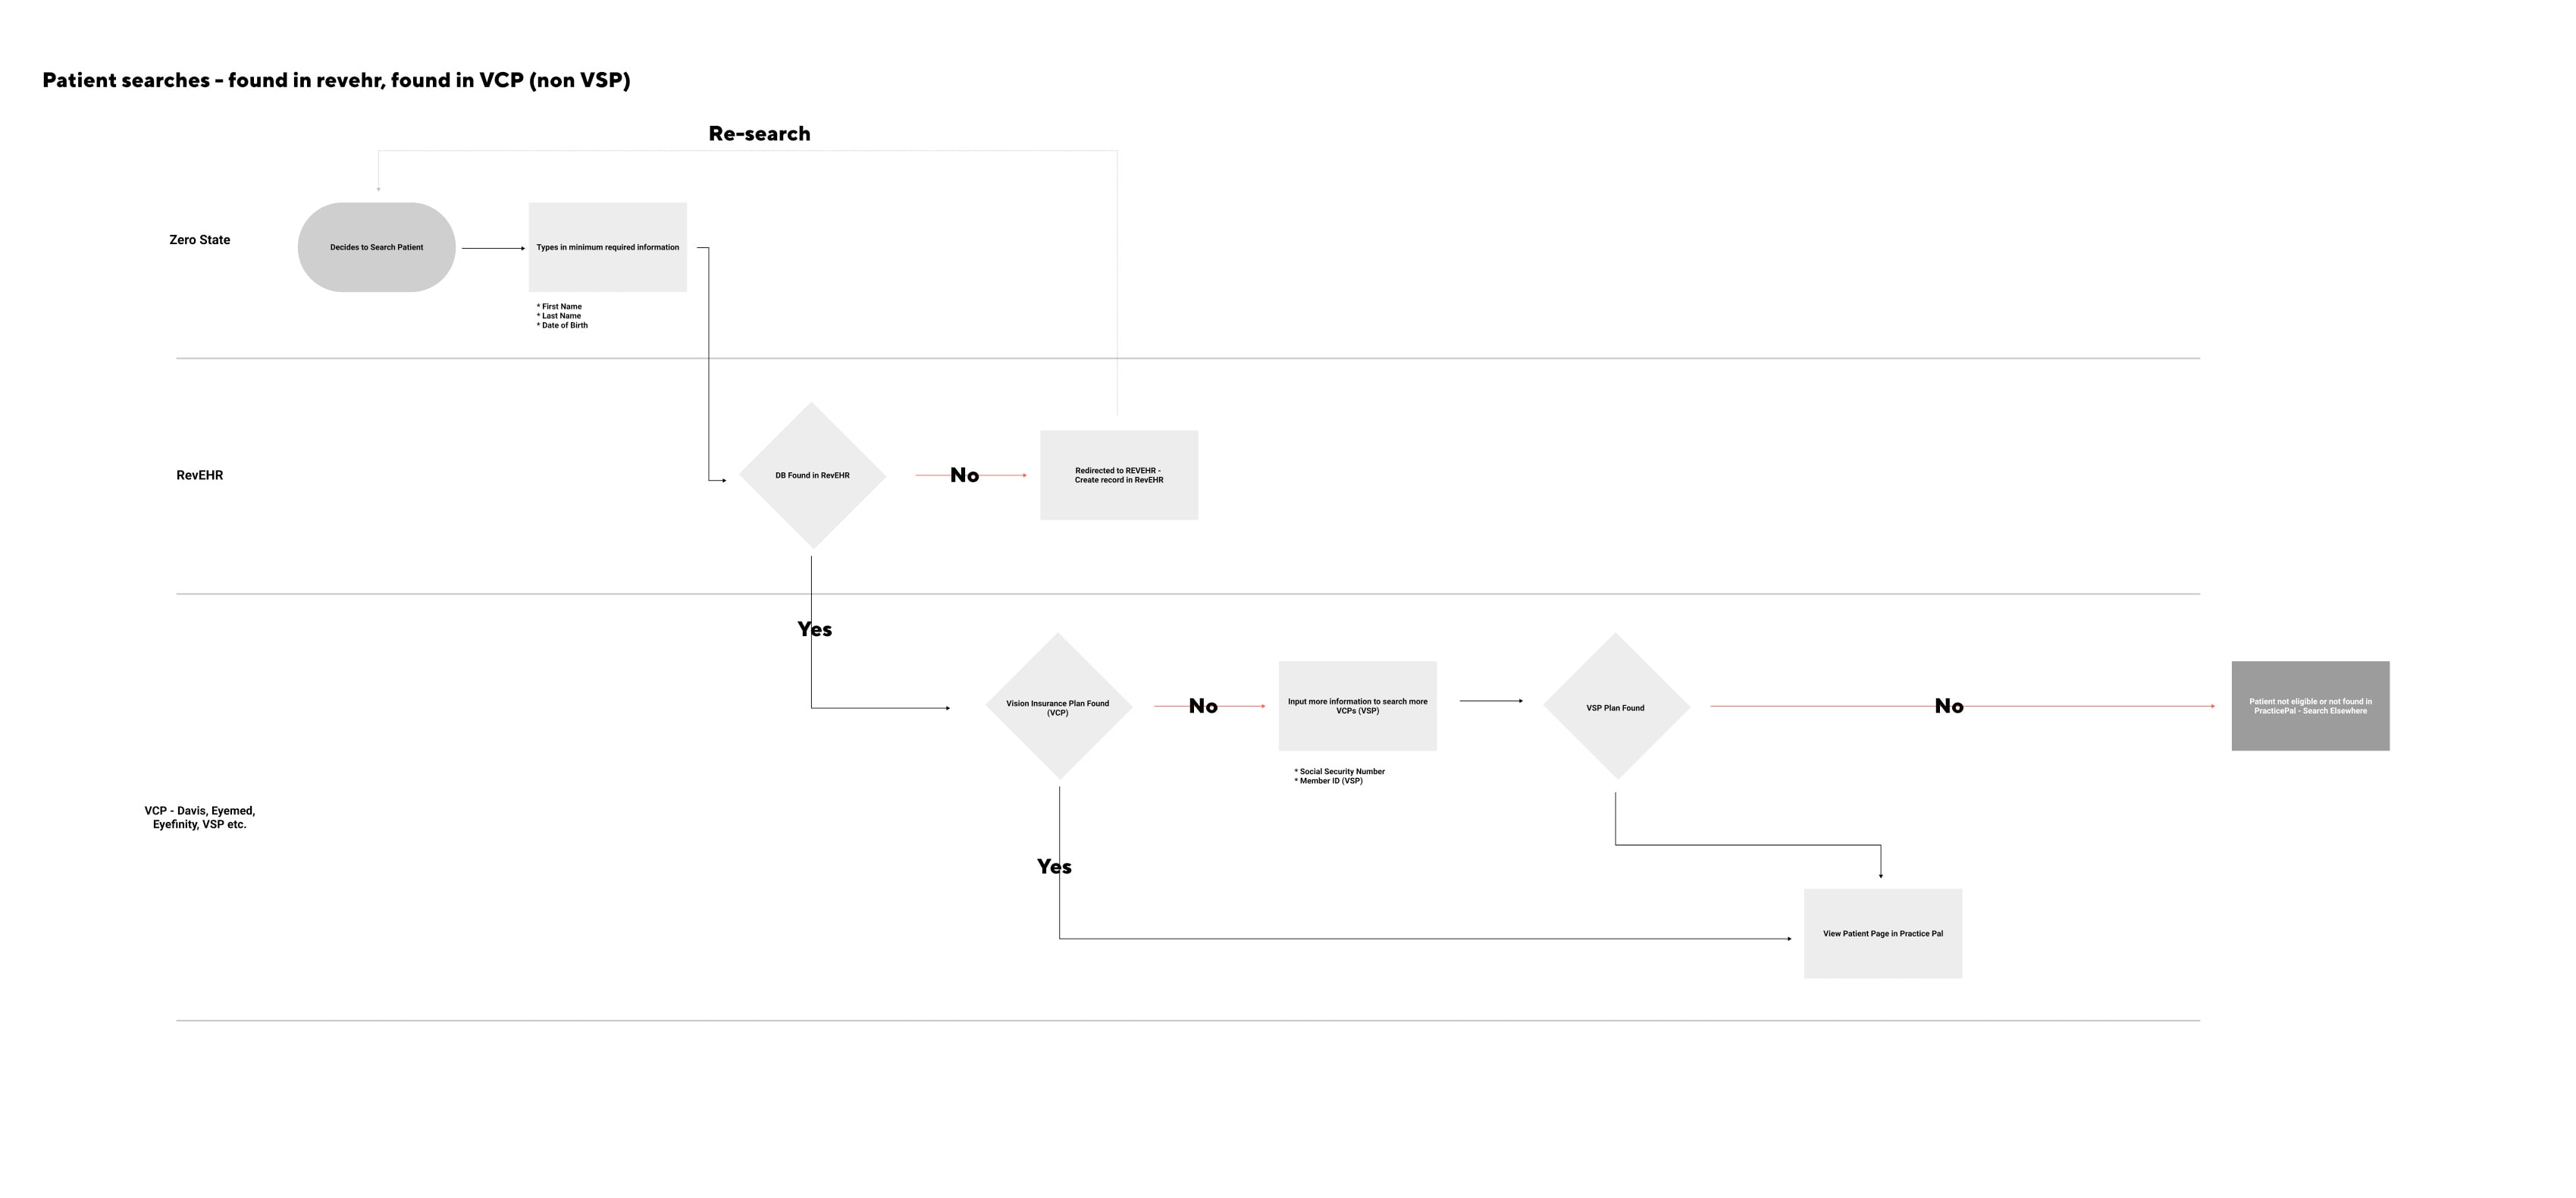
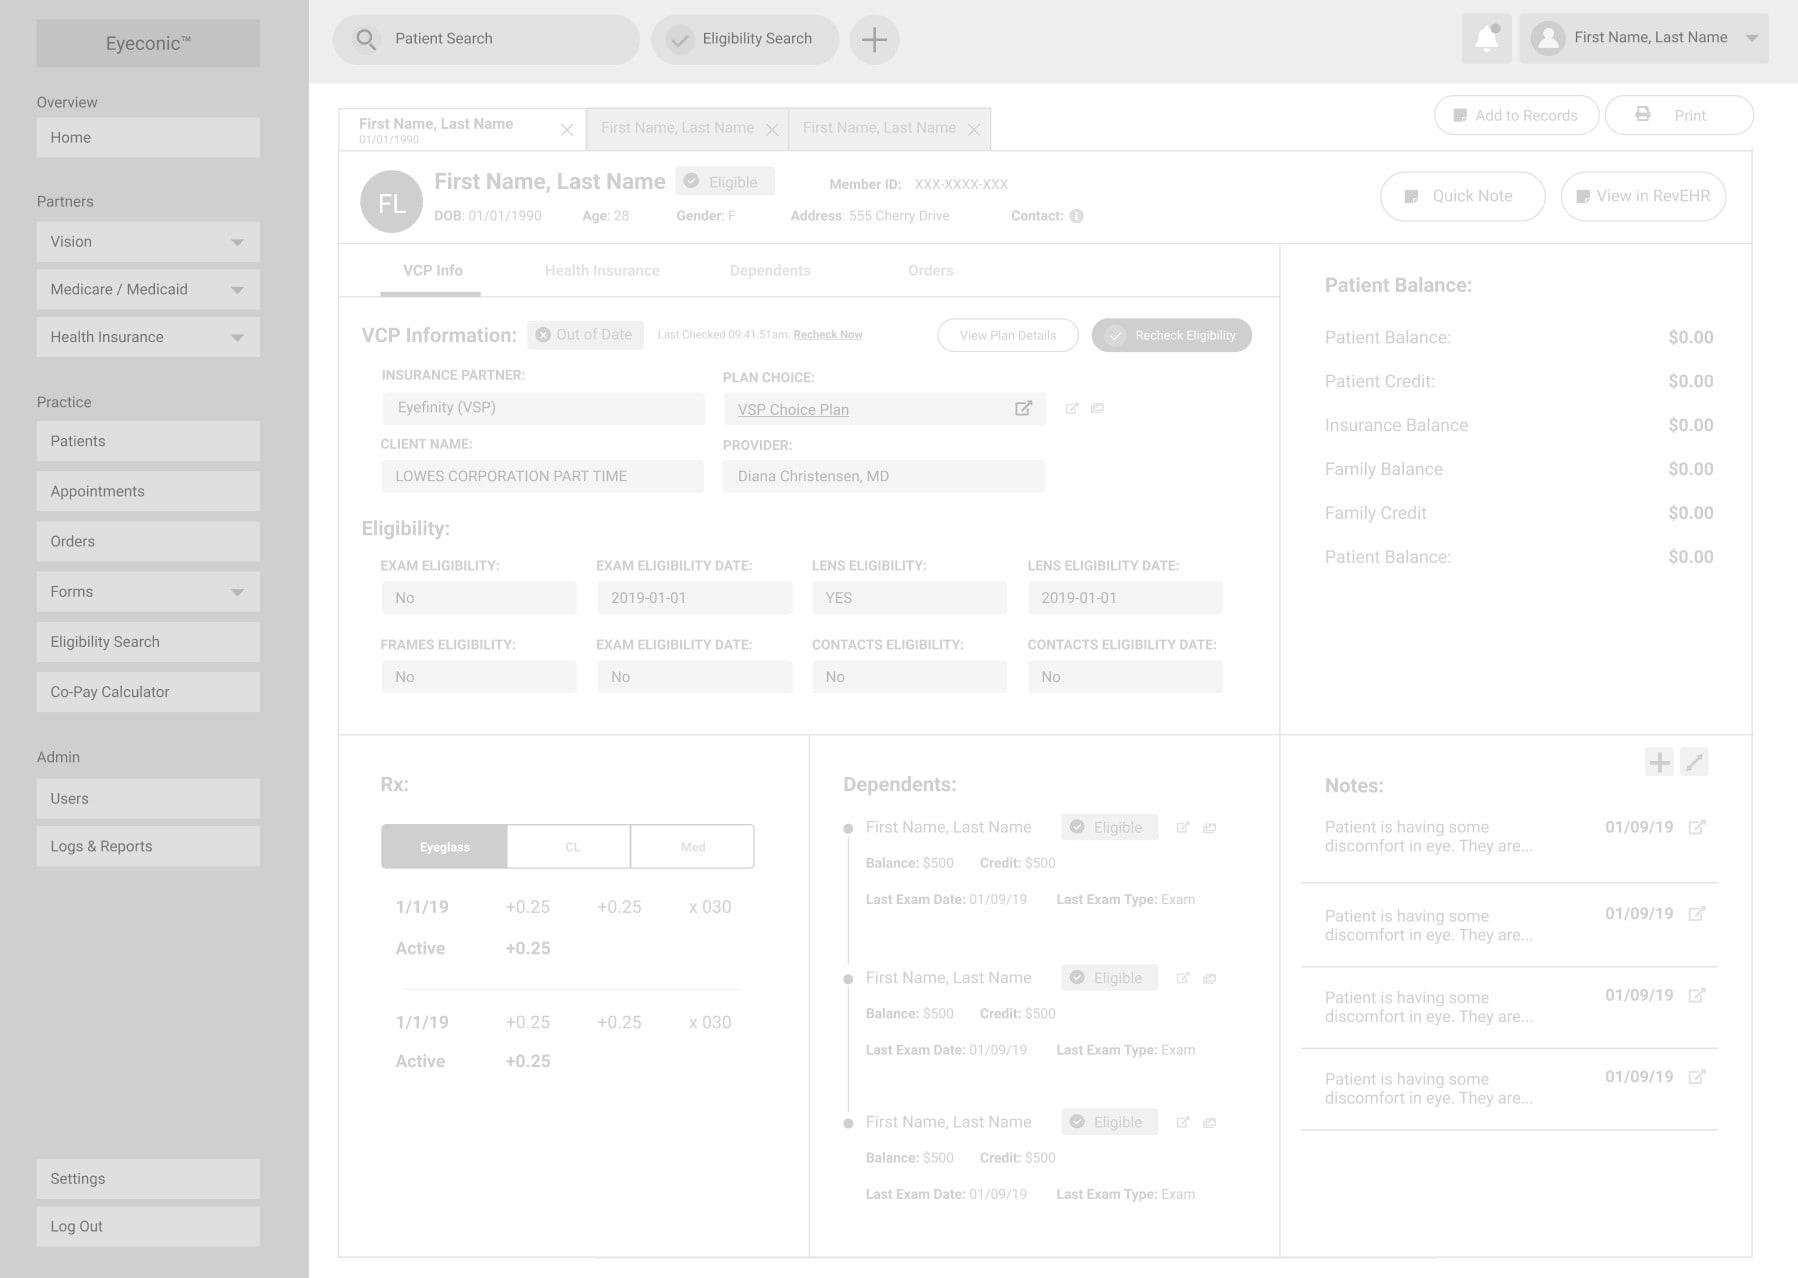
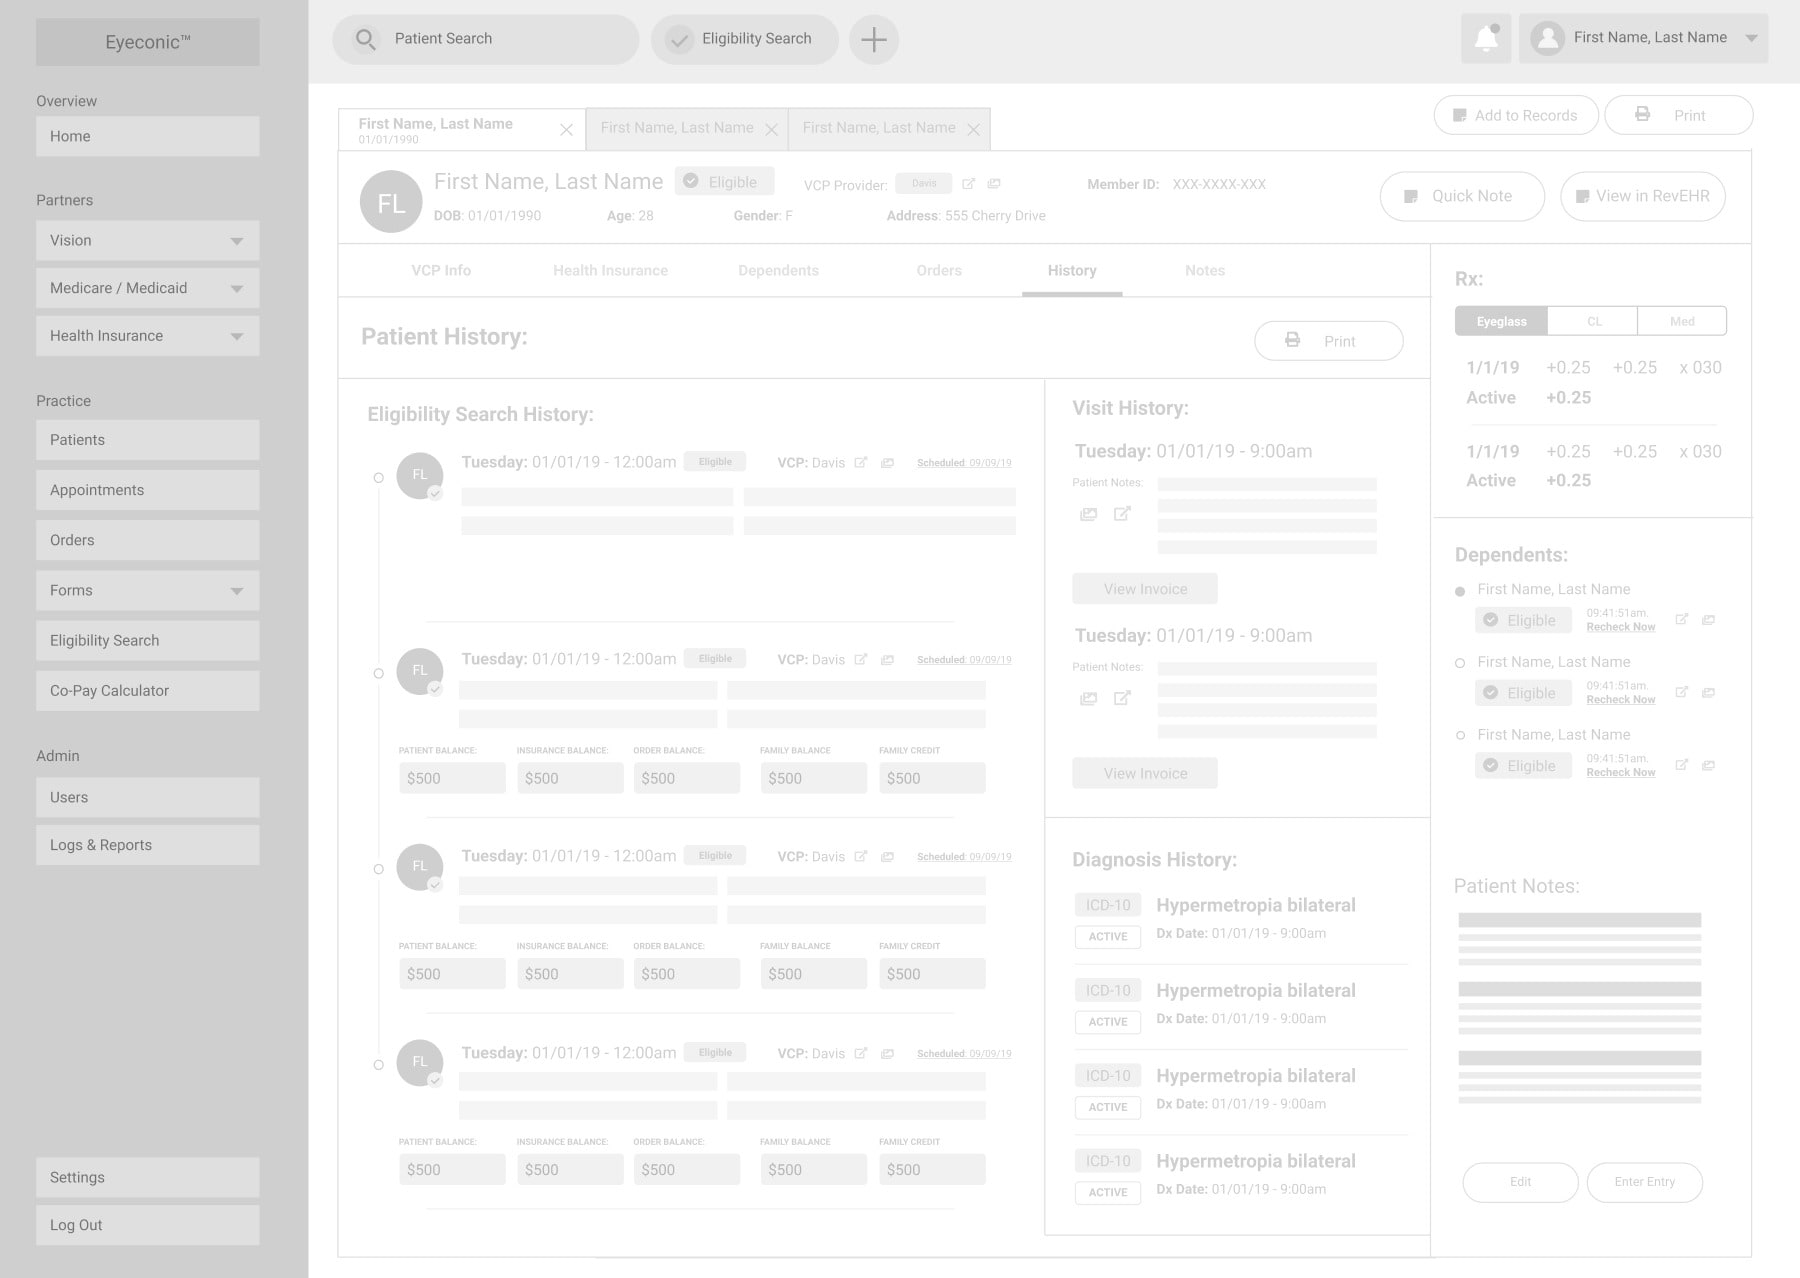
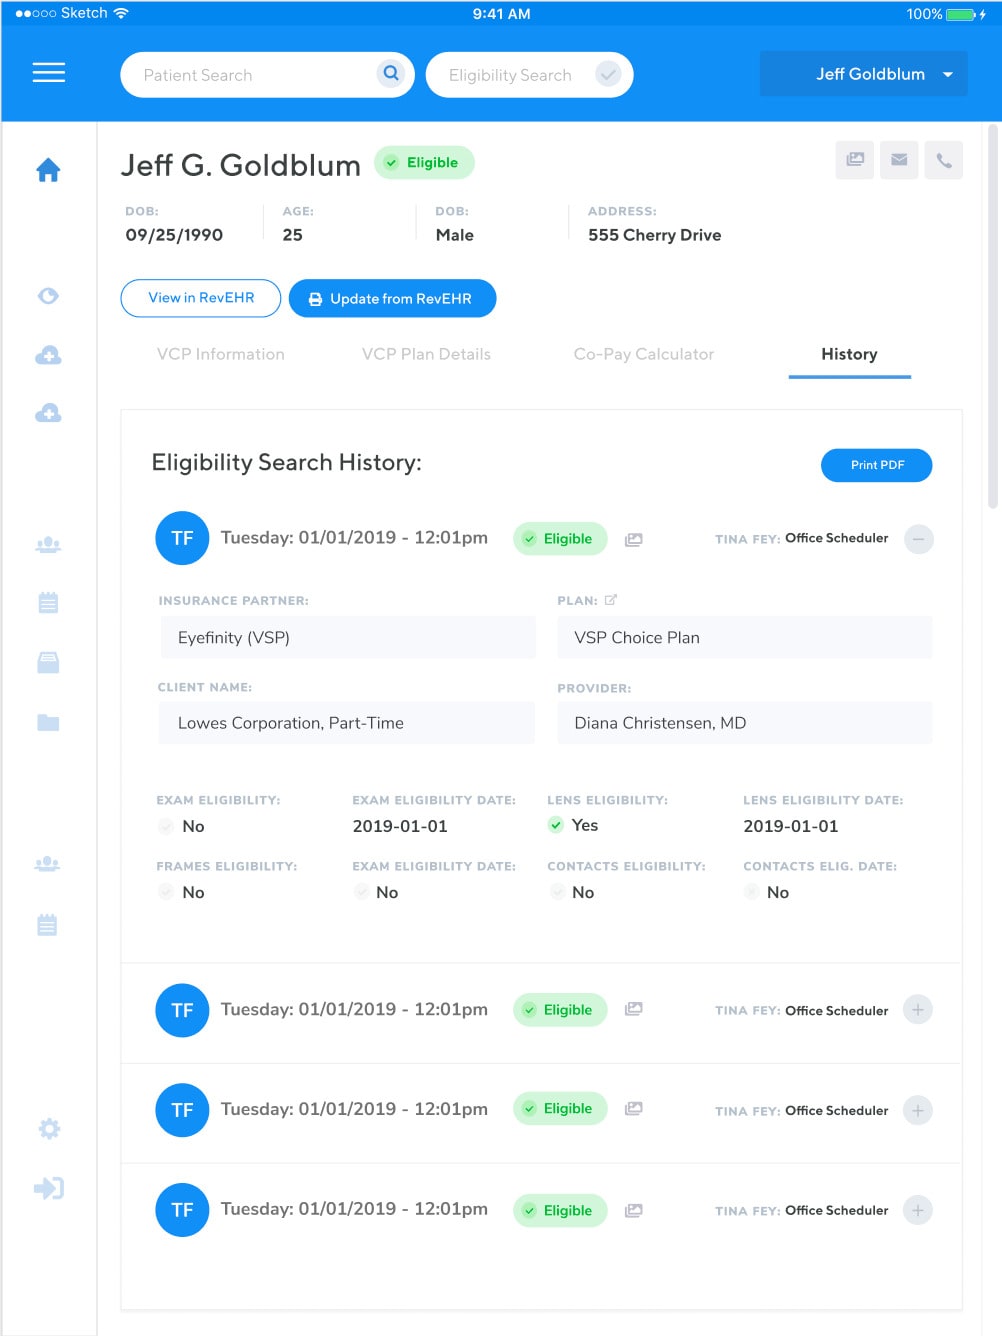
One of the primary features of the software is to search patient insurance eligibility and pull their electronic health record from any number of online providers. This feature was critical to make any of the other features. Because we are not replicating our own EHR system, and instead pulling information from other sources, it is a critical milestone to define this functionality as means to define what and how we design.
Although it is possible to pull electronic health records, they are not able to provide or verify current insurance plan details and eligibility. The current process is a time consuming process of cross-referencing various insurance plan providers while on the phone with the patient. Most of the time, they will have insurance cards that list out their plan and information, but it is still a manual process and the odd edge case scenarios that make this complicated are more common than one might think. This includes: patients on a family plan, patients on a unique company insurance plan, patients with multiple insurance plans, expiring plans, changing insurance benefits, just to name a few.
After conducting a variety of interviews and market research, we determined to build this insurance eligibility search as the key differentiator in the market that everything else would add upon. It is the feature that doesn’t exist anywhere and the primary pain point of everything we are hoping to achieve.
We ran these search solutions and prototypes by the client who in turn shared some of these early iterations with the employees at their practice. After some back and forth and useful feedback, we determined that our users will often need to be doing a number of things in the dashboard while searching for patient eligibility. This is often a time sensitive issue as the prospective patient is on the phone so they need to be able to multi-task.
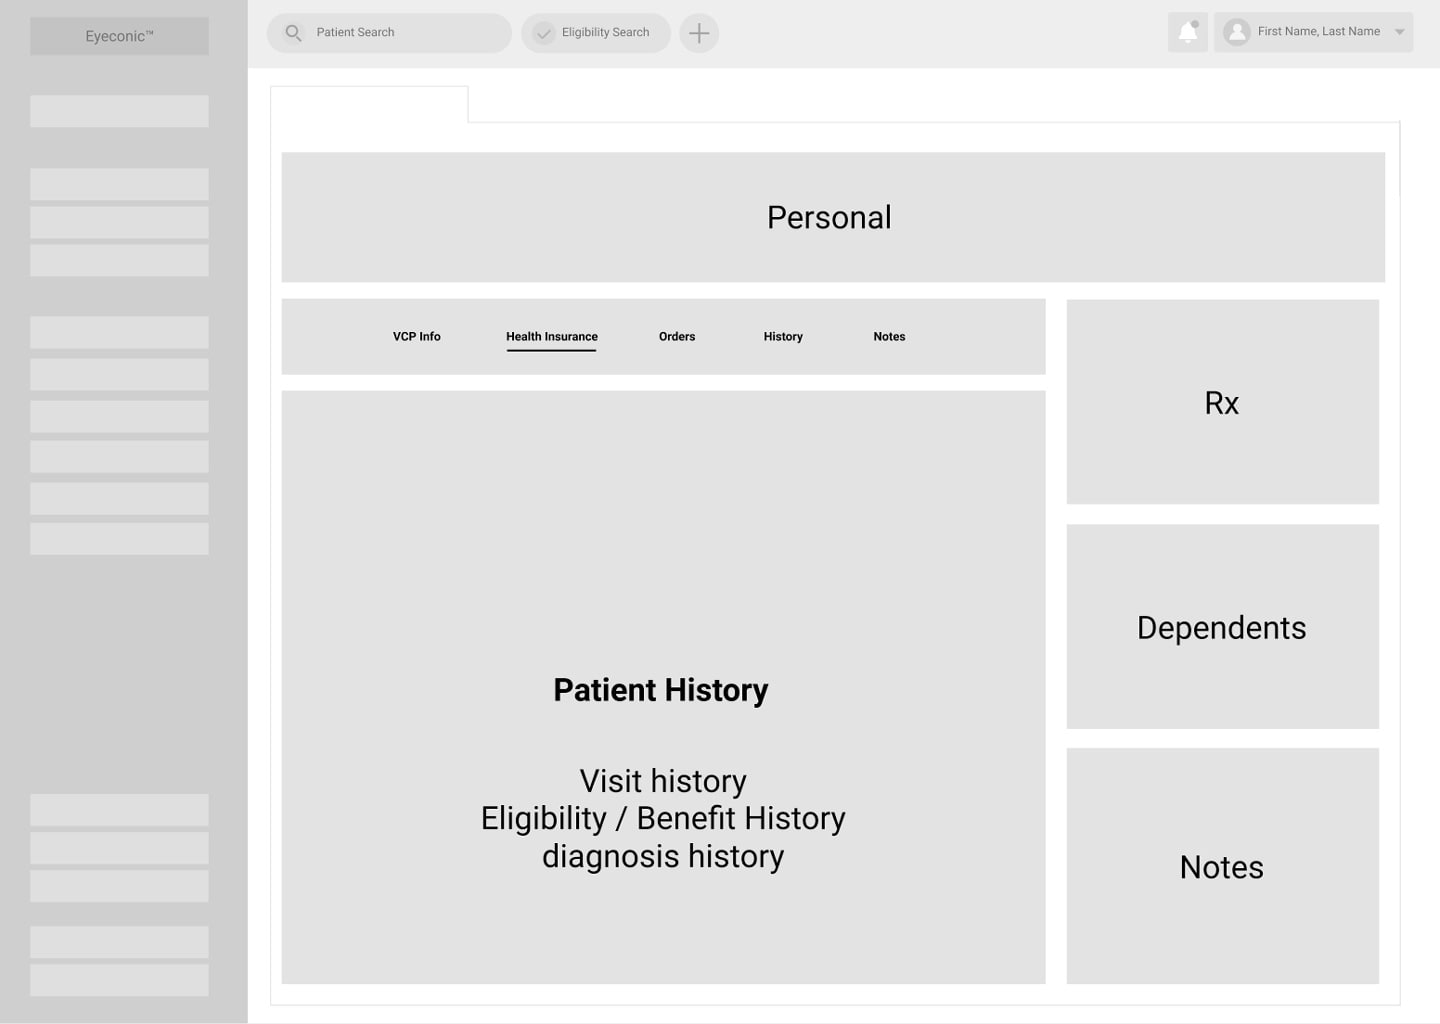
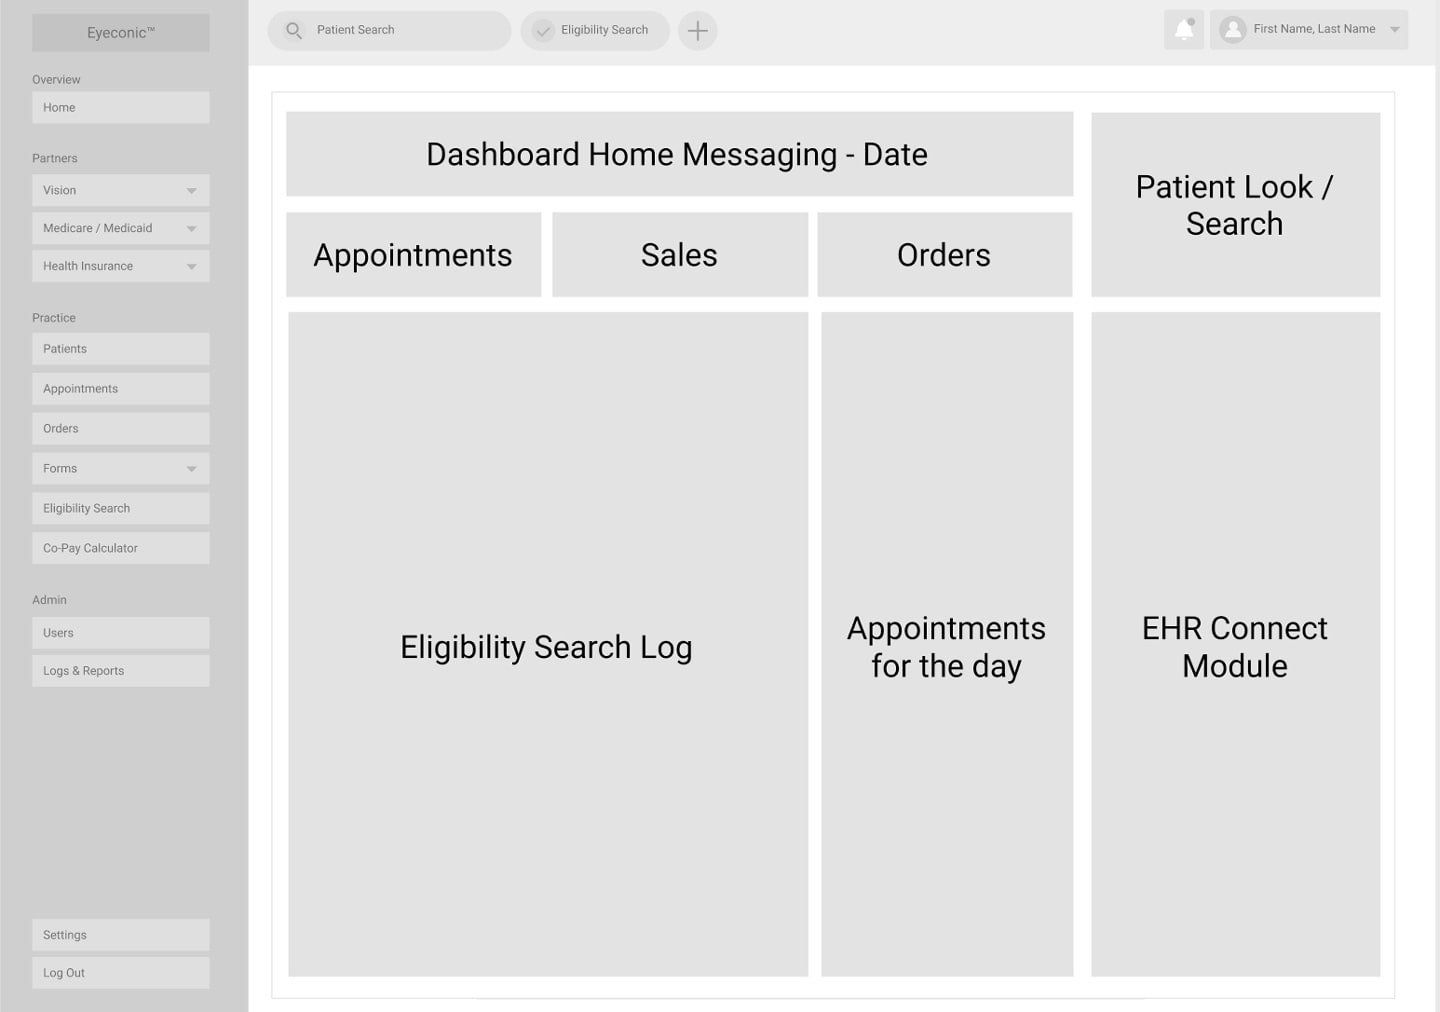
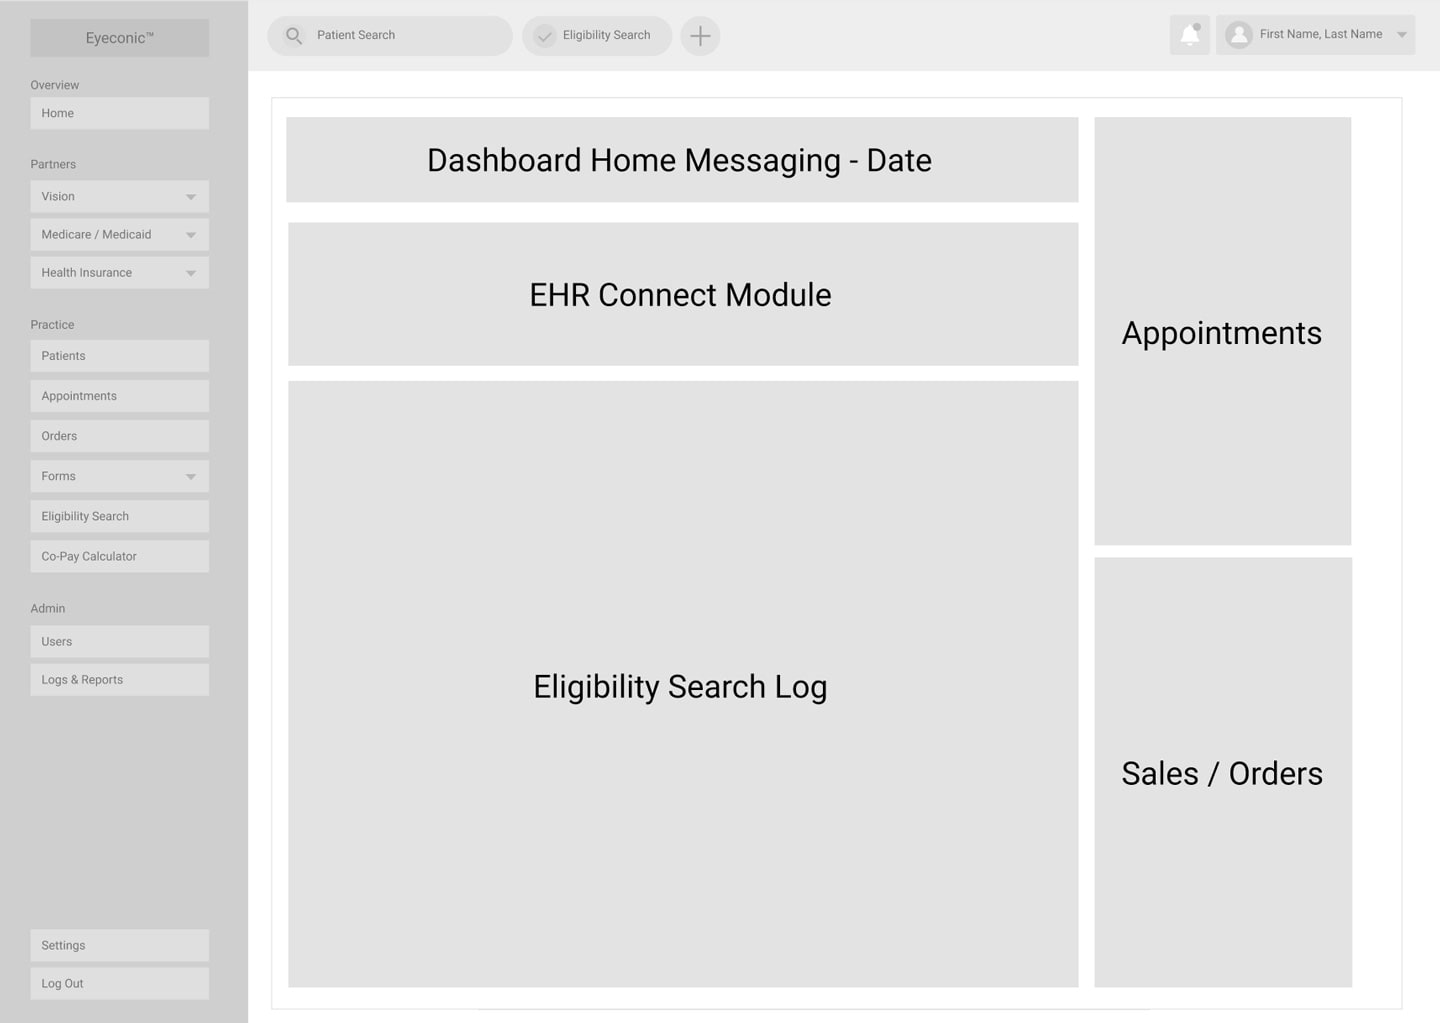
We had a great idea to create a search solution built into the dashboard that can conduct insurance eligibility searches in the background so a user may show and hide the search while they interact with other areas of the dashboard. This background search was well received so we adjusted our designs from a page designated for search, to a slide out area that a user can search for patient eligibility, see search results and navigate to pages once results are found. In conjunction with this, it will pull their EHR and populate it into our dashboard for storage to create a comprehensive patient profile. Previously searched individuals are stored in the dashboard for later use / quick reference.
building out the early experience
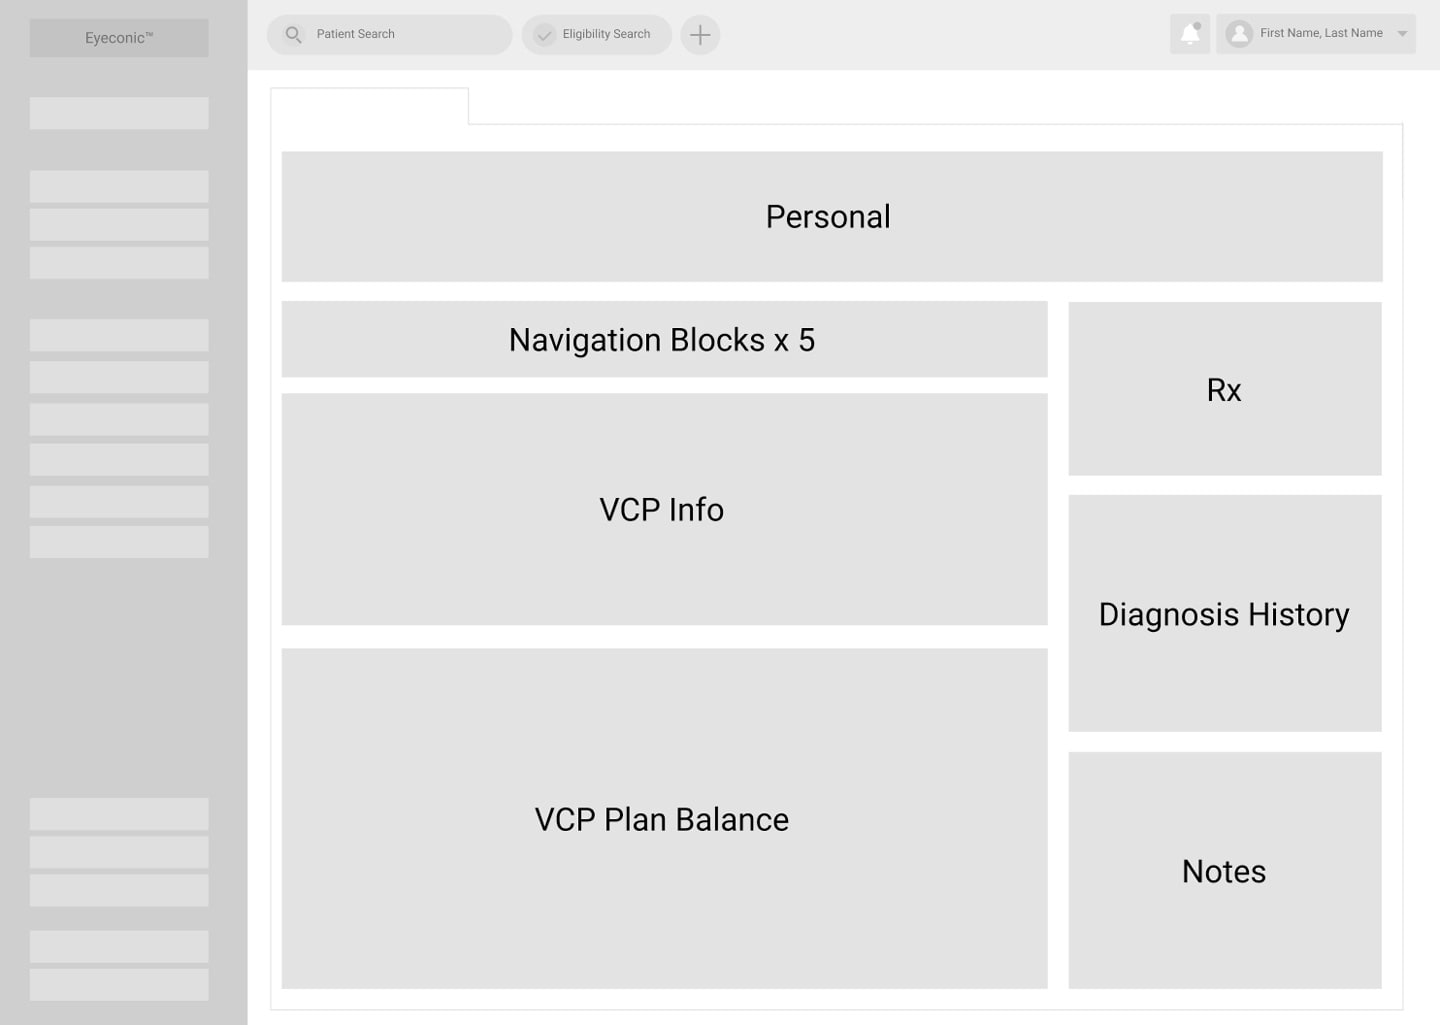
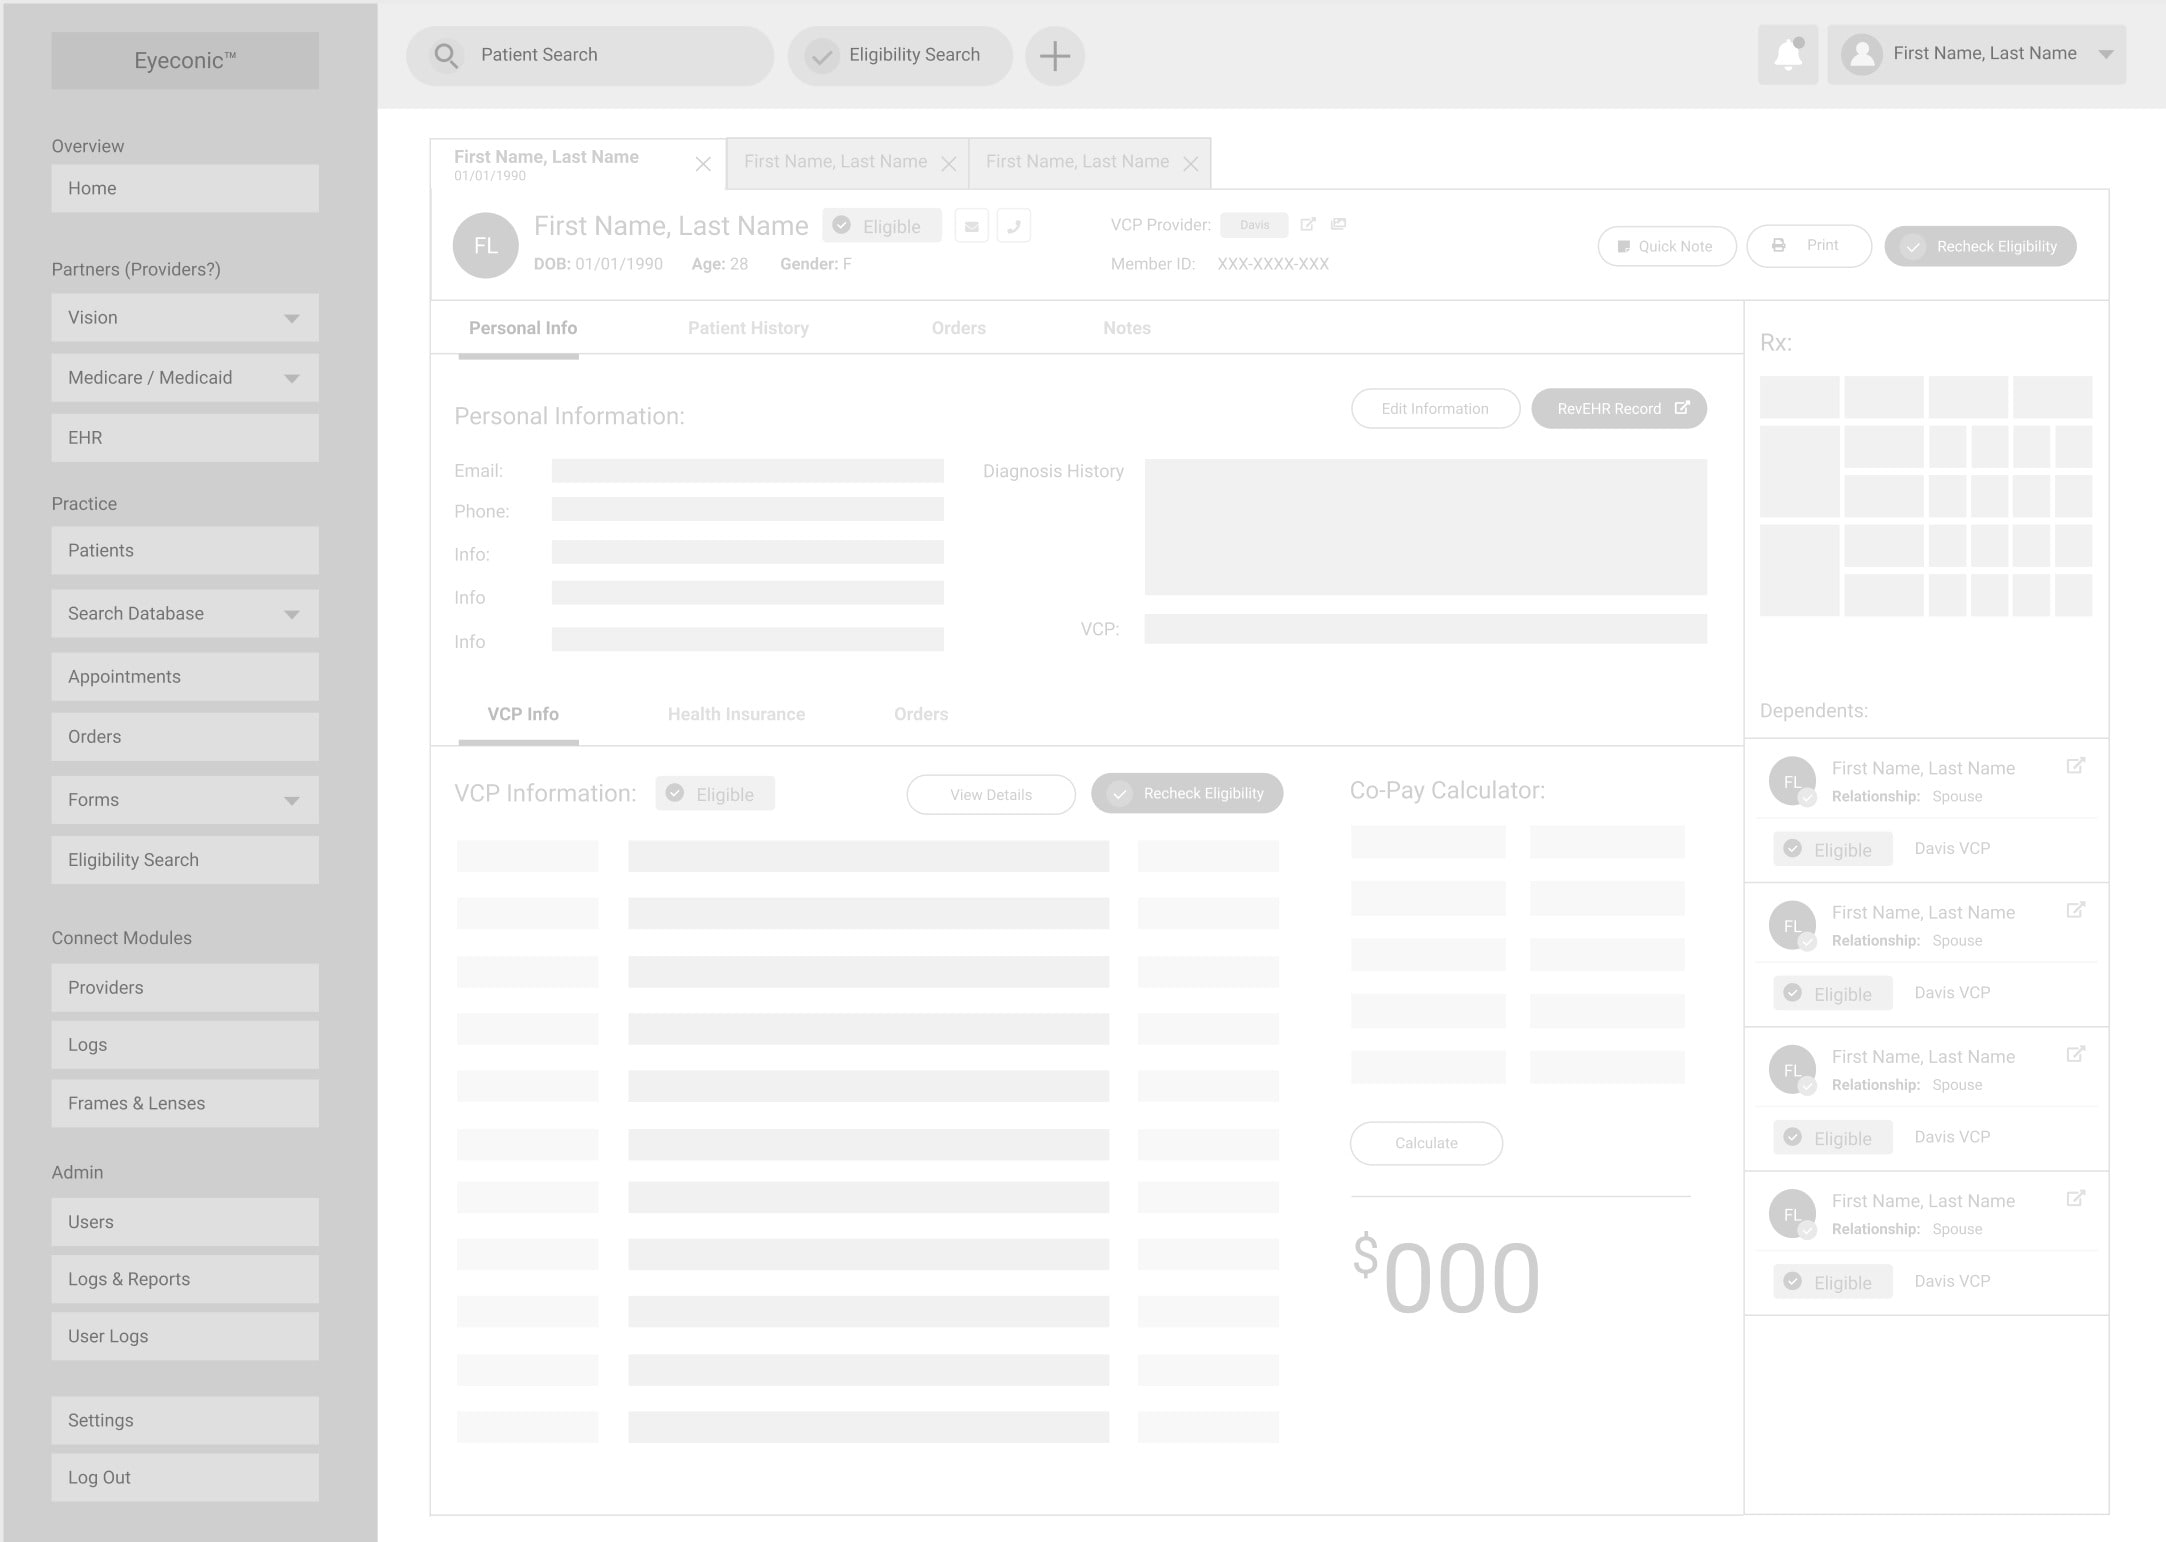
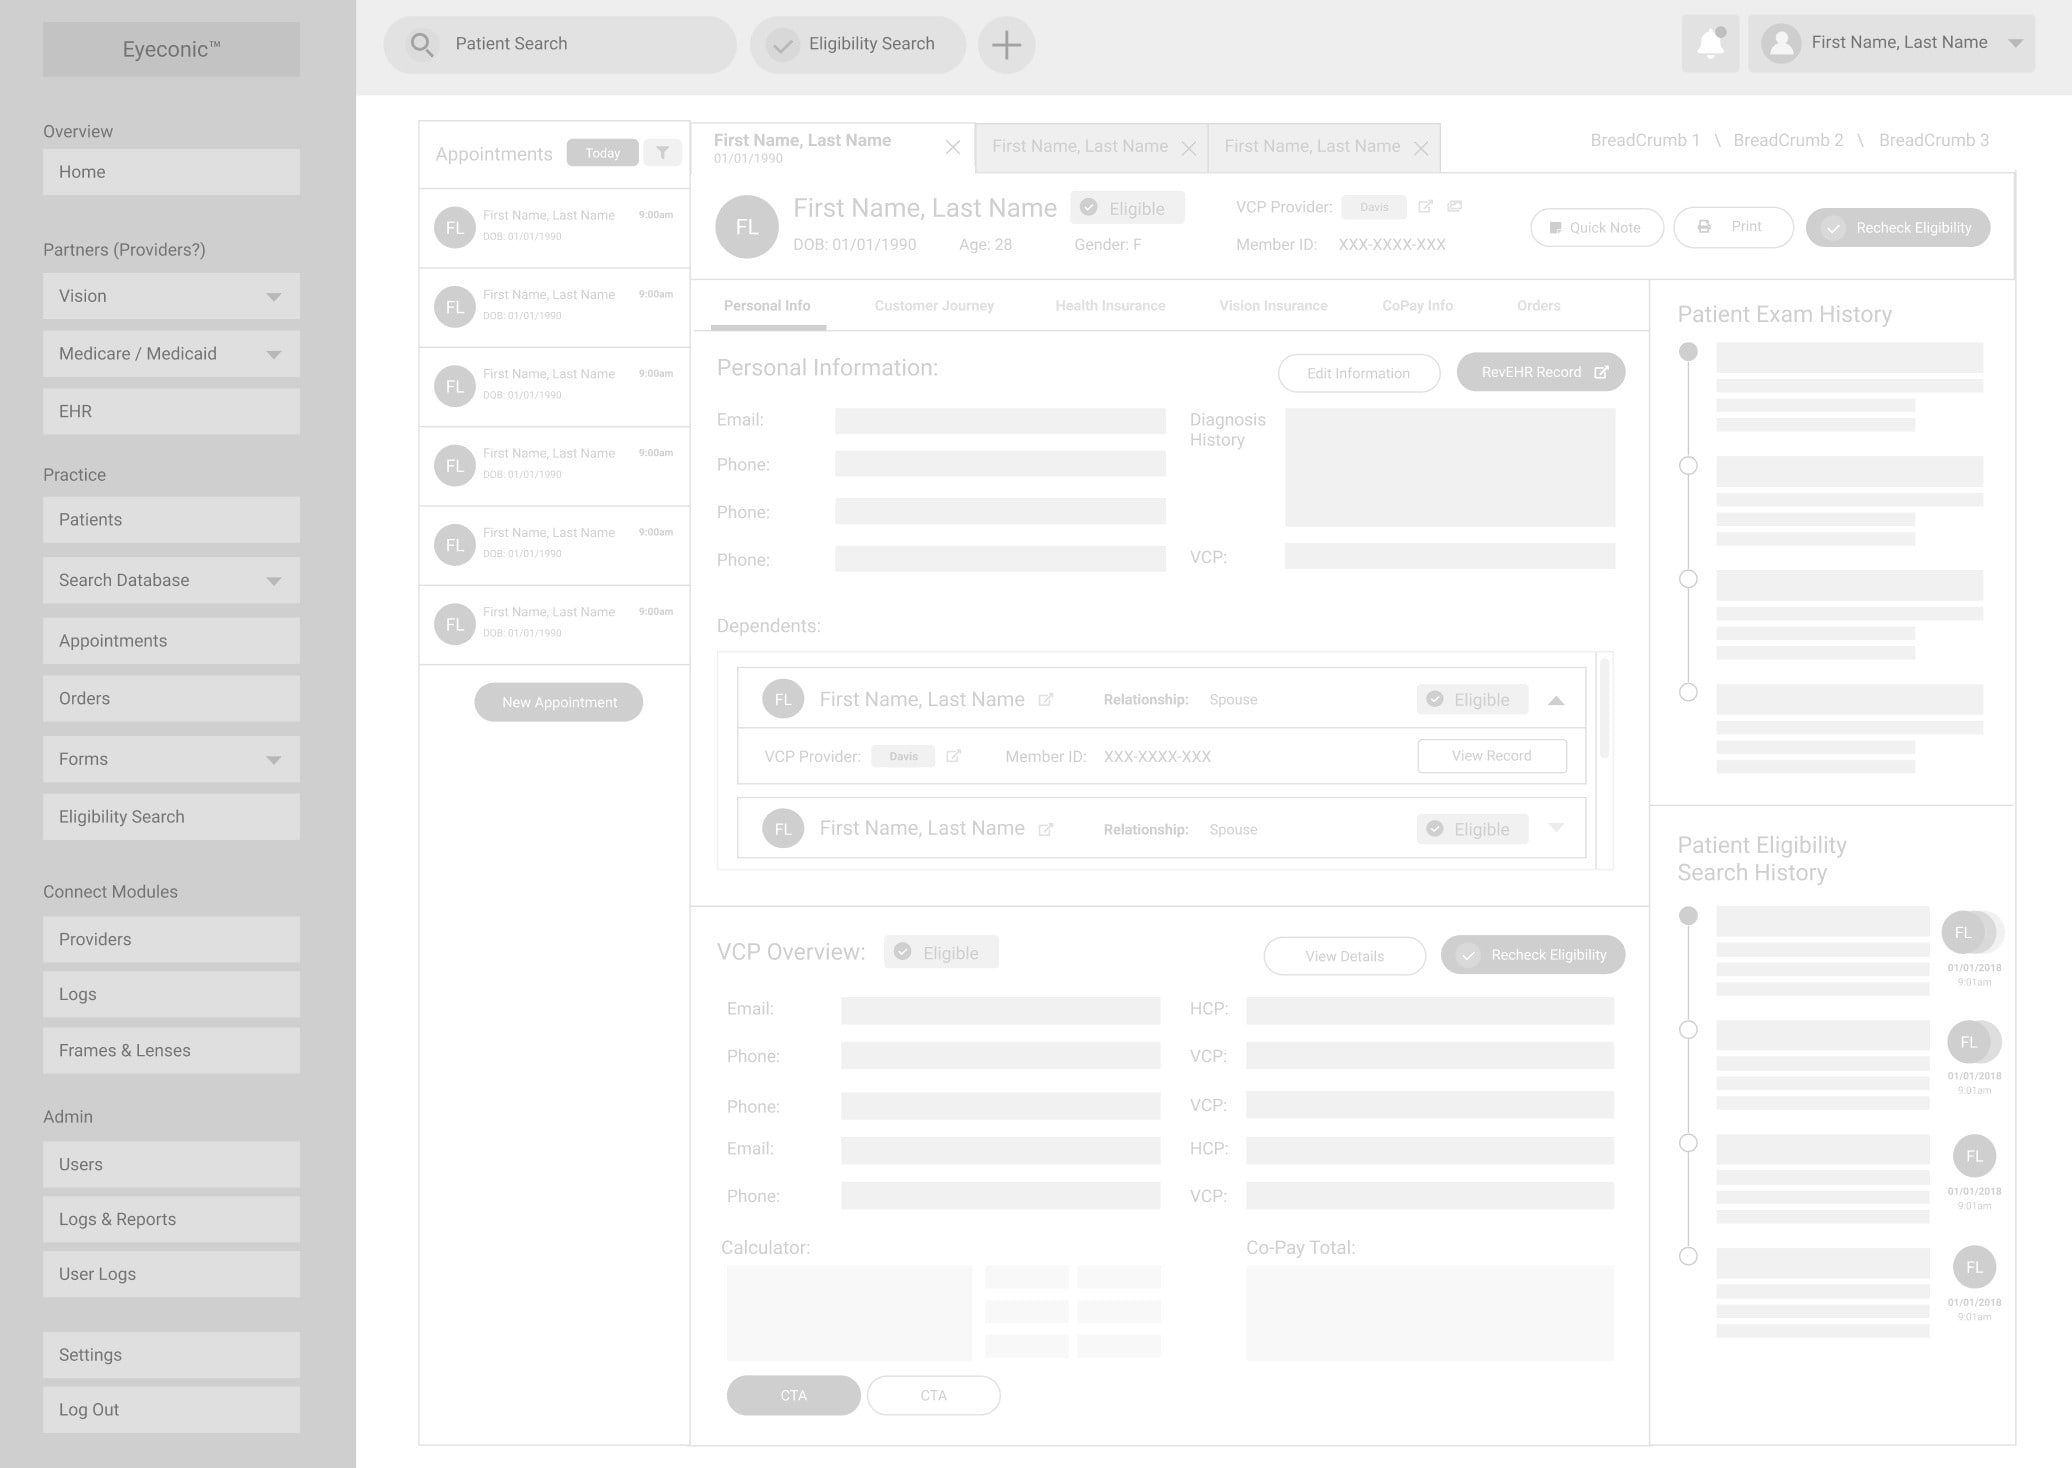
Wireframes
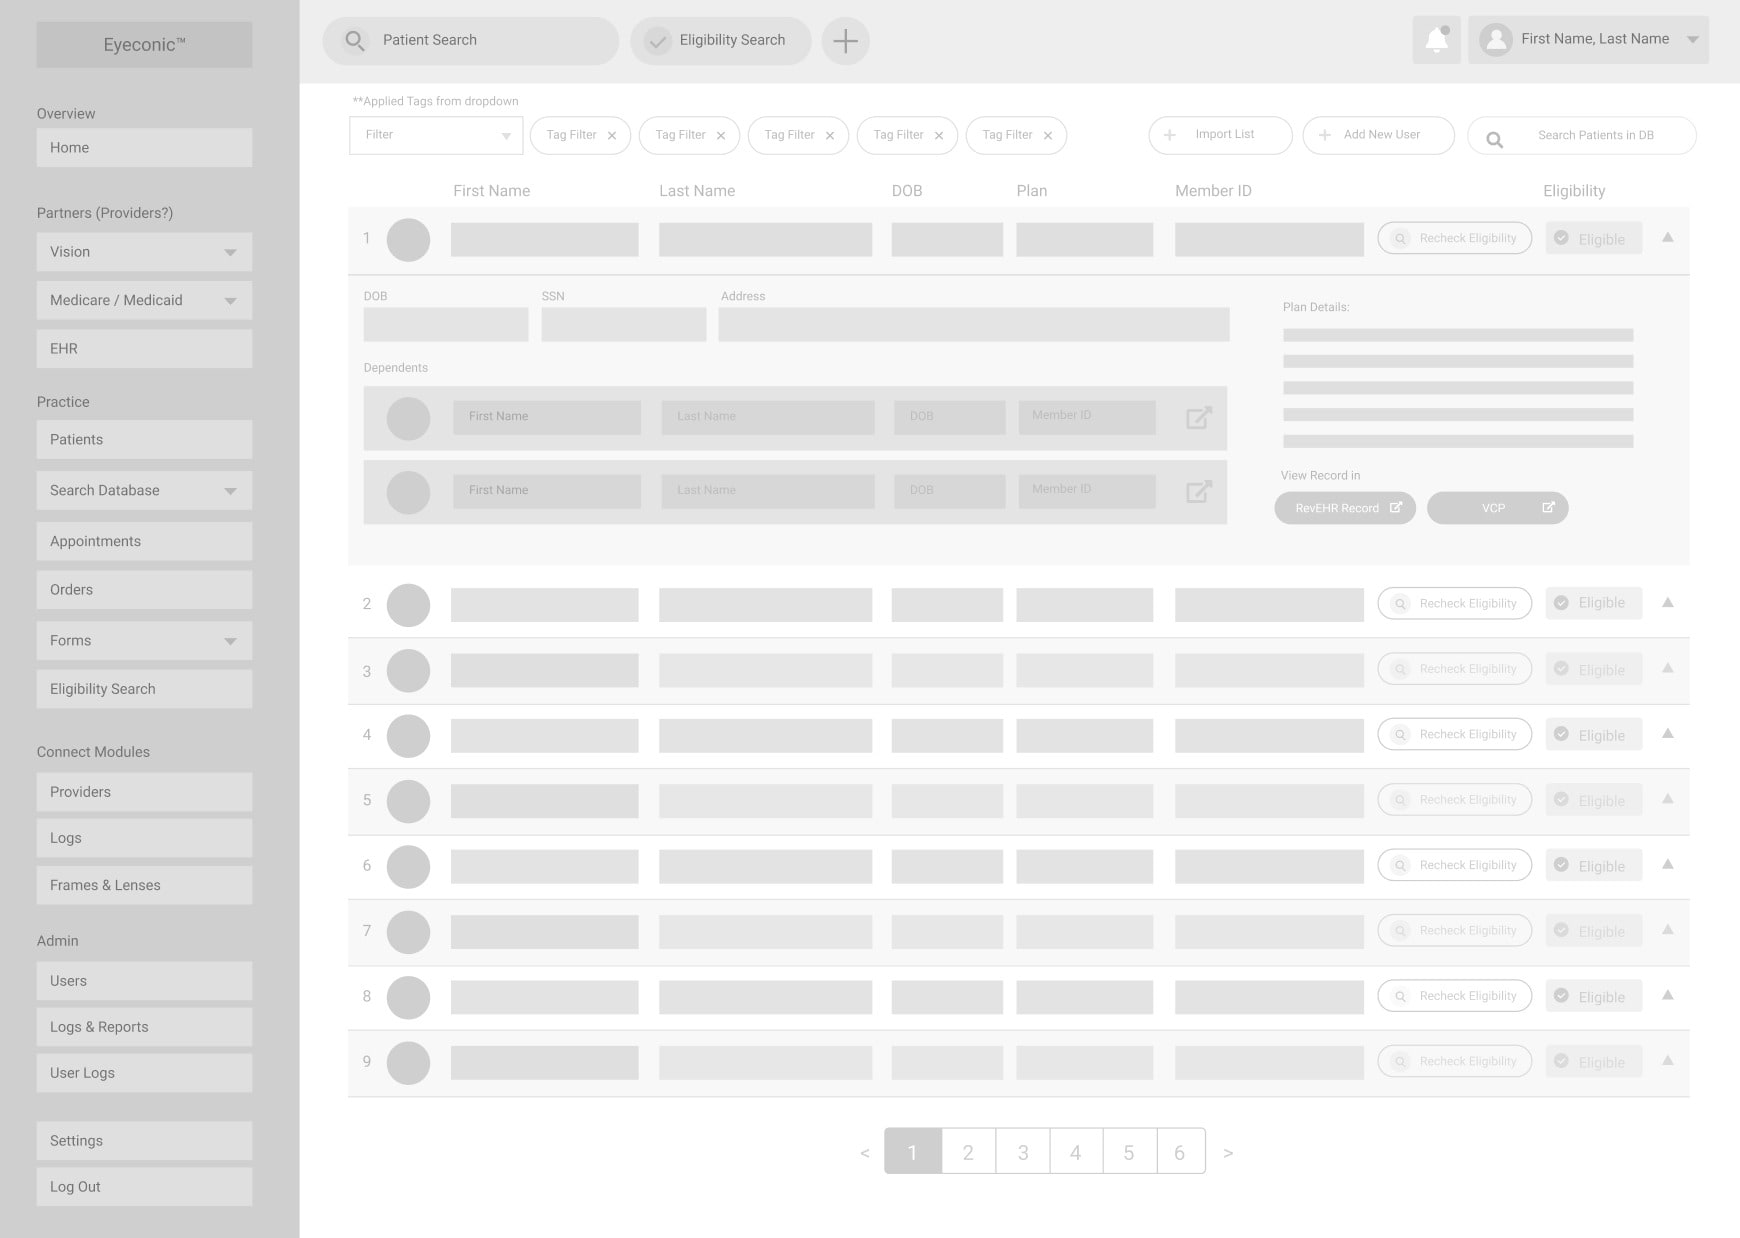
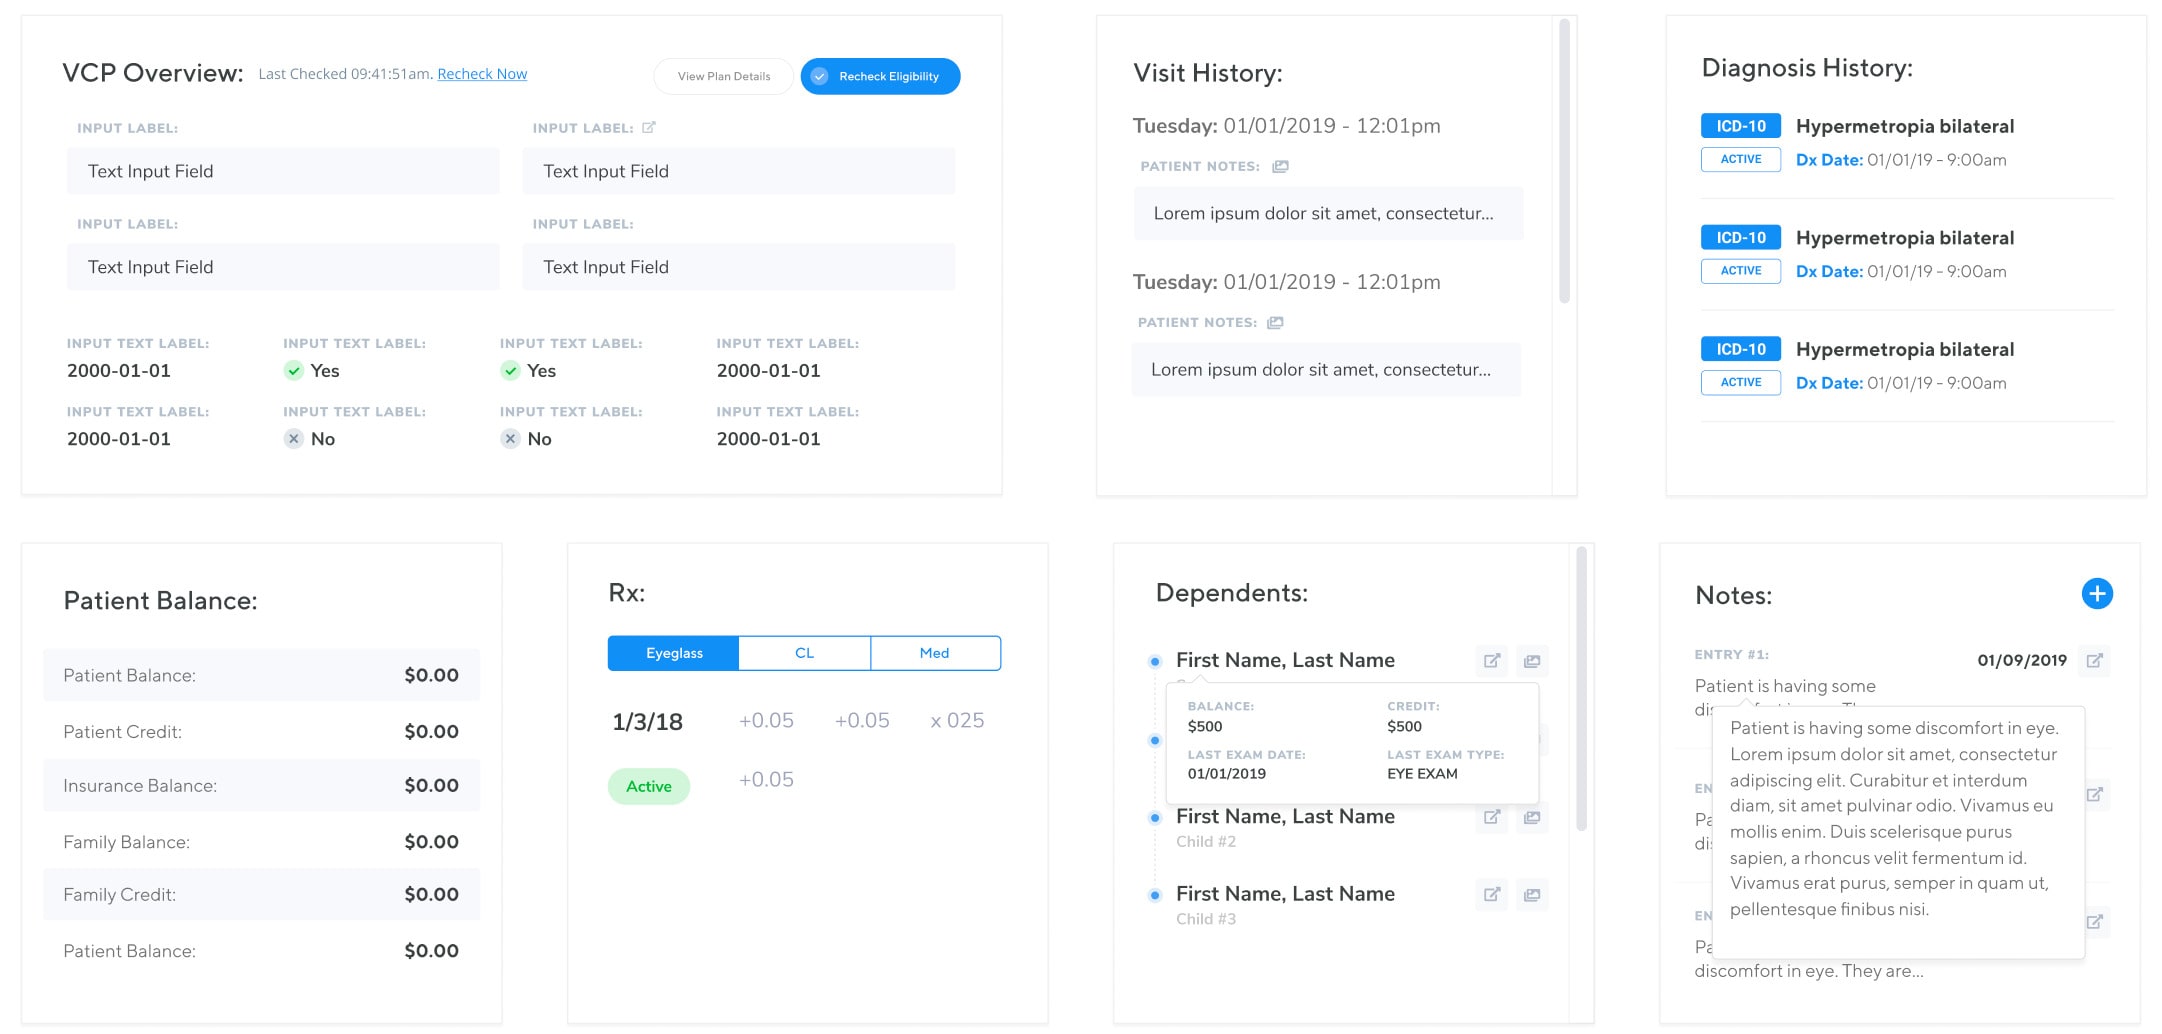
We expanded on the initial search prototypes that we created using that work to begin piecing together our proposed feature set, information architecture and making sure all the required information was visible, easy to access, and informative.
The wireframe process took a lot of back and forth with our client. We began with very simple wireframes, eventually moving into very detailed wireframes (without visual styles) to solidify an understanding of how all the information would be displayed. This was time consuming, but did an excellent job of displaying to ourselves and the client how the information could fit into a small area and manage to be mobile responsive.
The main areas we explored with wireframes include:
- Patient Search
- Patient List - Table of all patients in the database
- Patient details
- Account details
- Login and registration
- Settings Pages
With the help of the client, we eventually dialed in the right wireframes that outline the specific feature set that is possible during our MVP feature. Not every feature we had anticipated we could solve from the user journey was possible to solve for in the first iteration due to the time and budget constraints.
piecing everything together
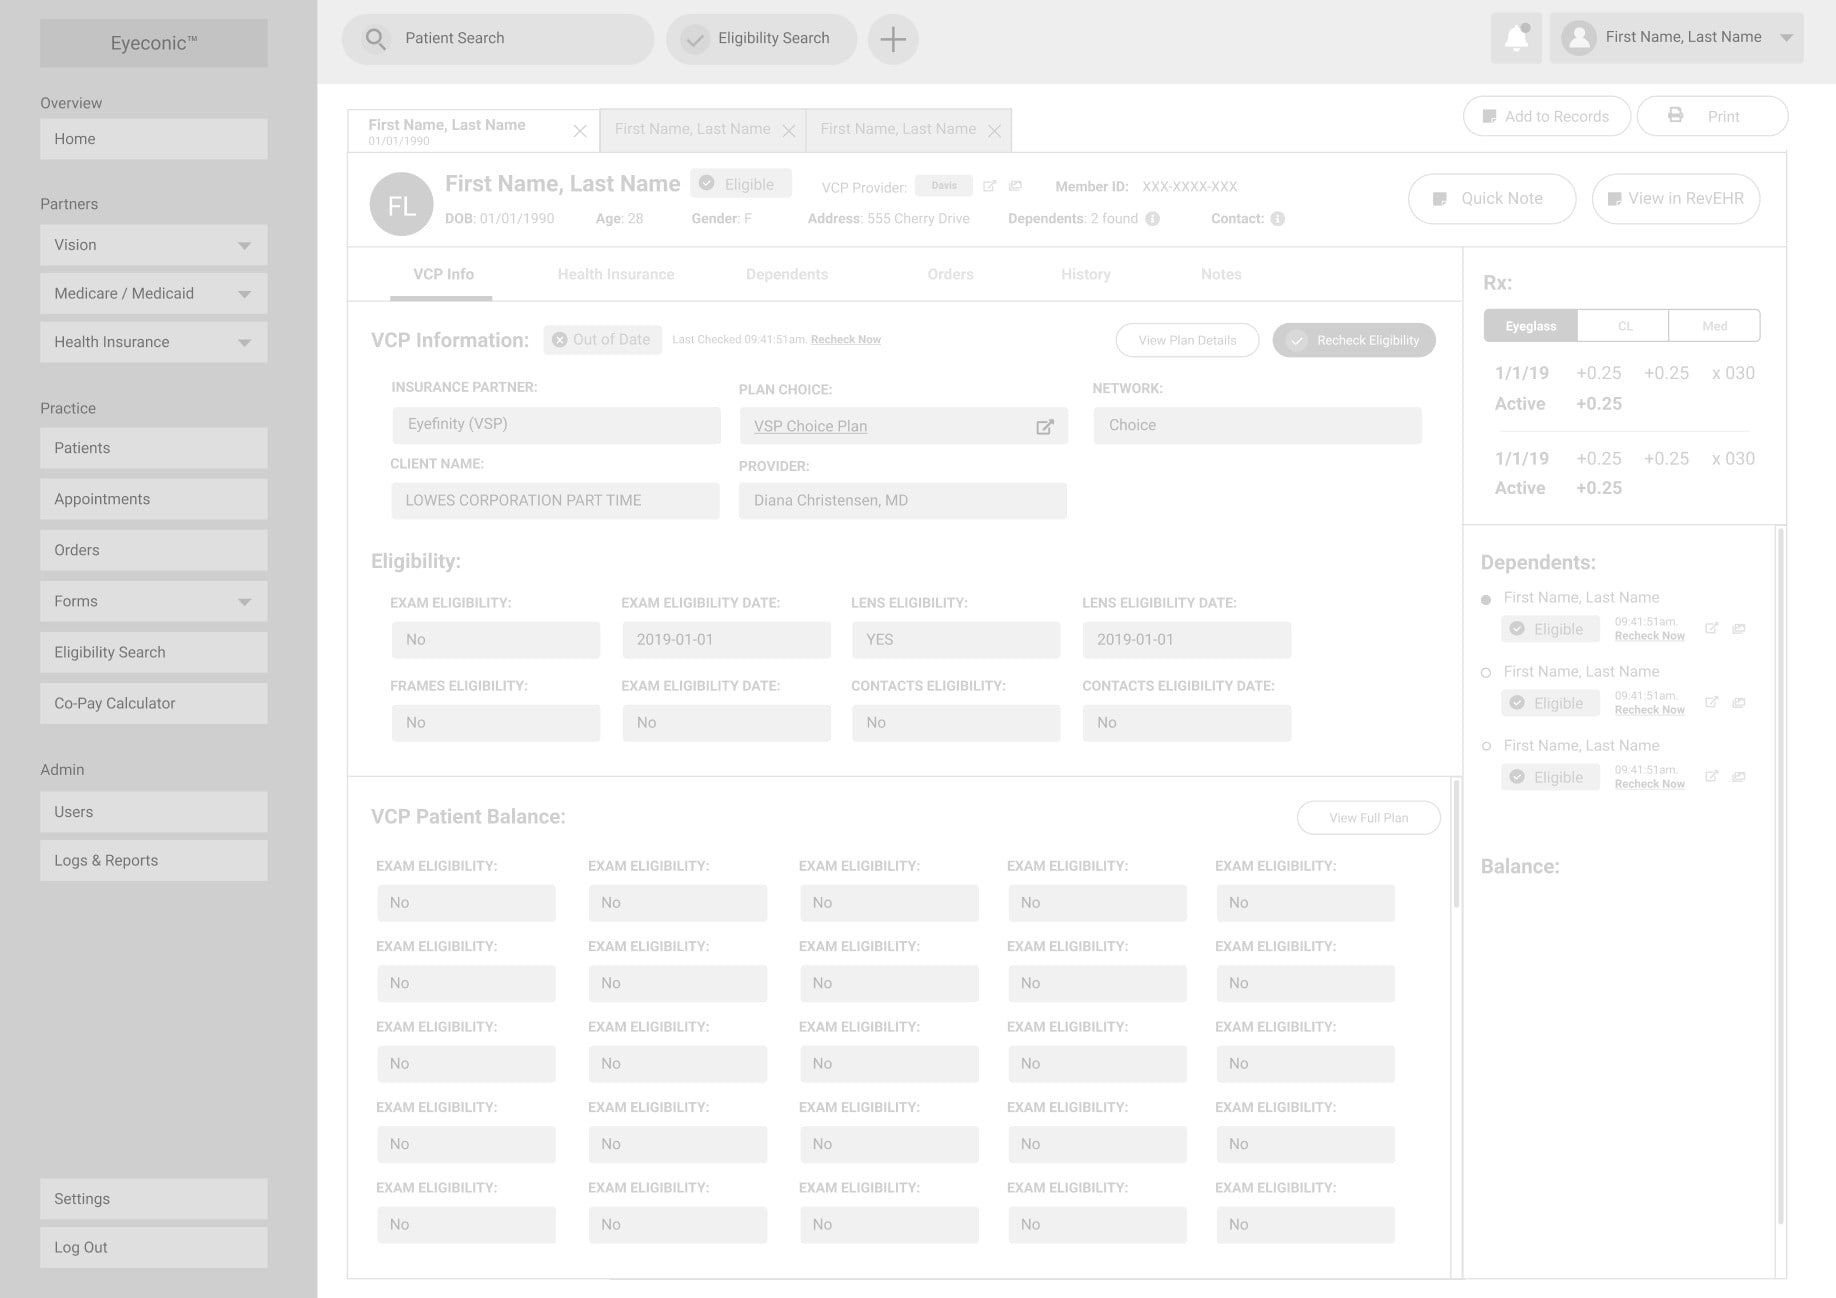
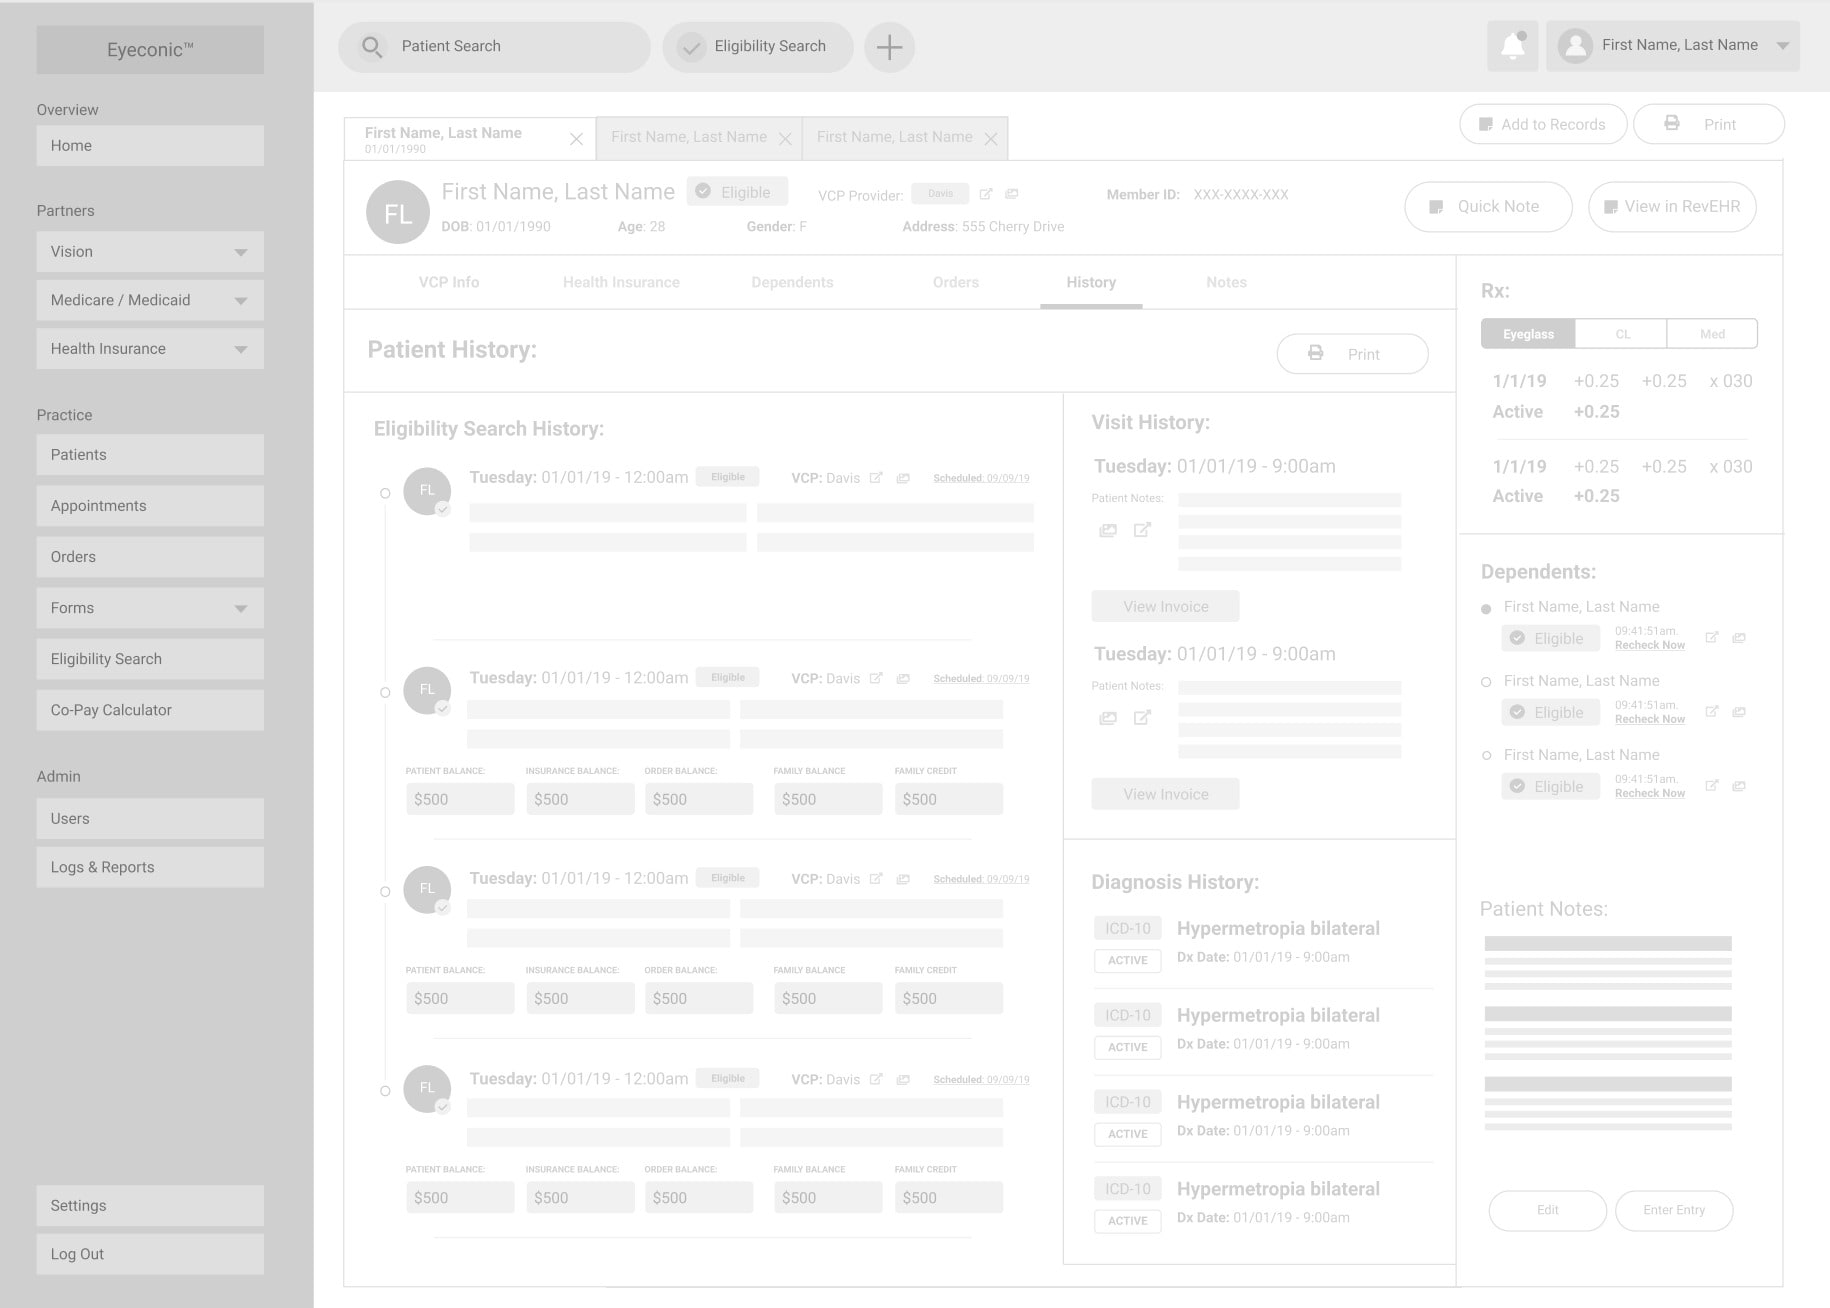
Polished Designs / UI
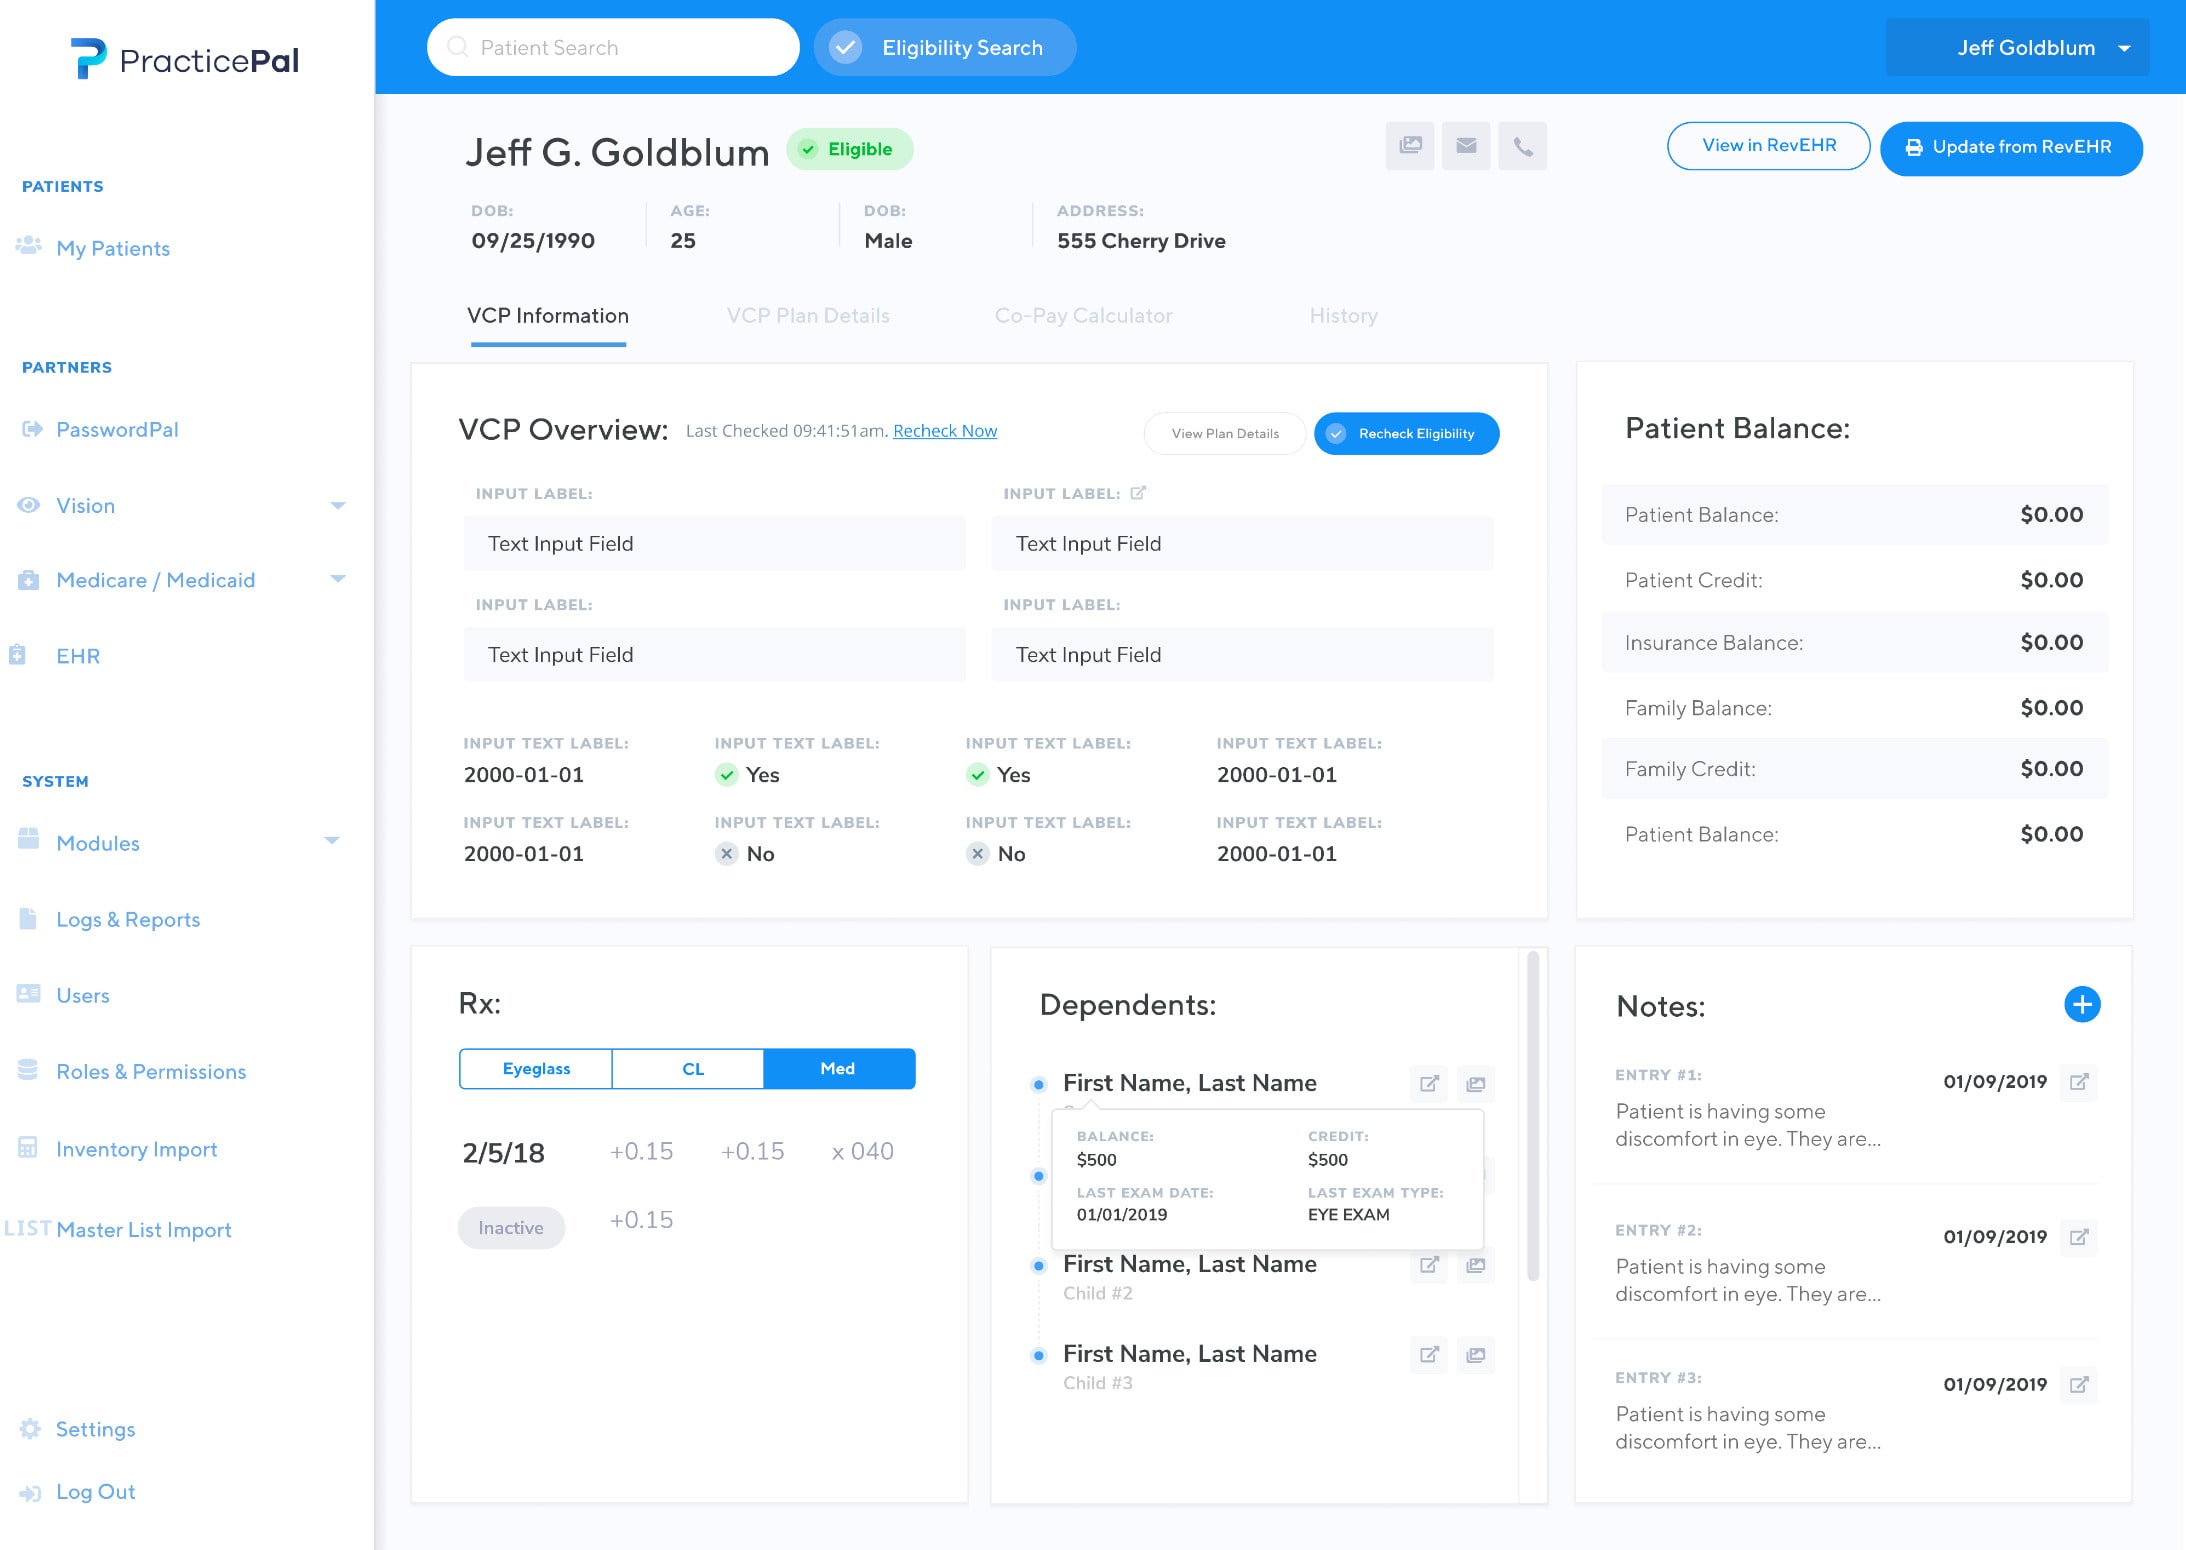
Ultimately, after a number of reviews with the detailed wireframes, the client / stakeholders gave us the okay to move forward with high-definition designs in-line with the feedback we had received.
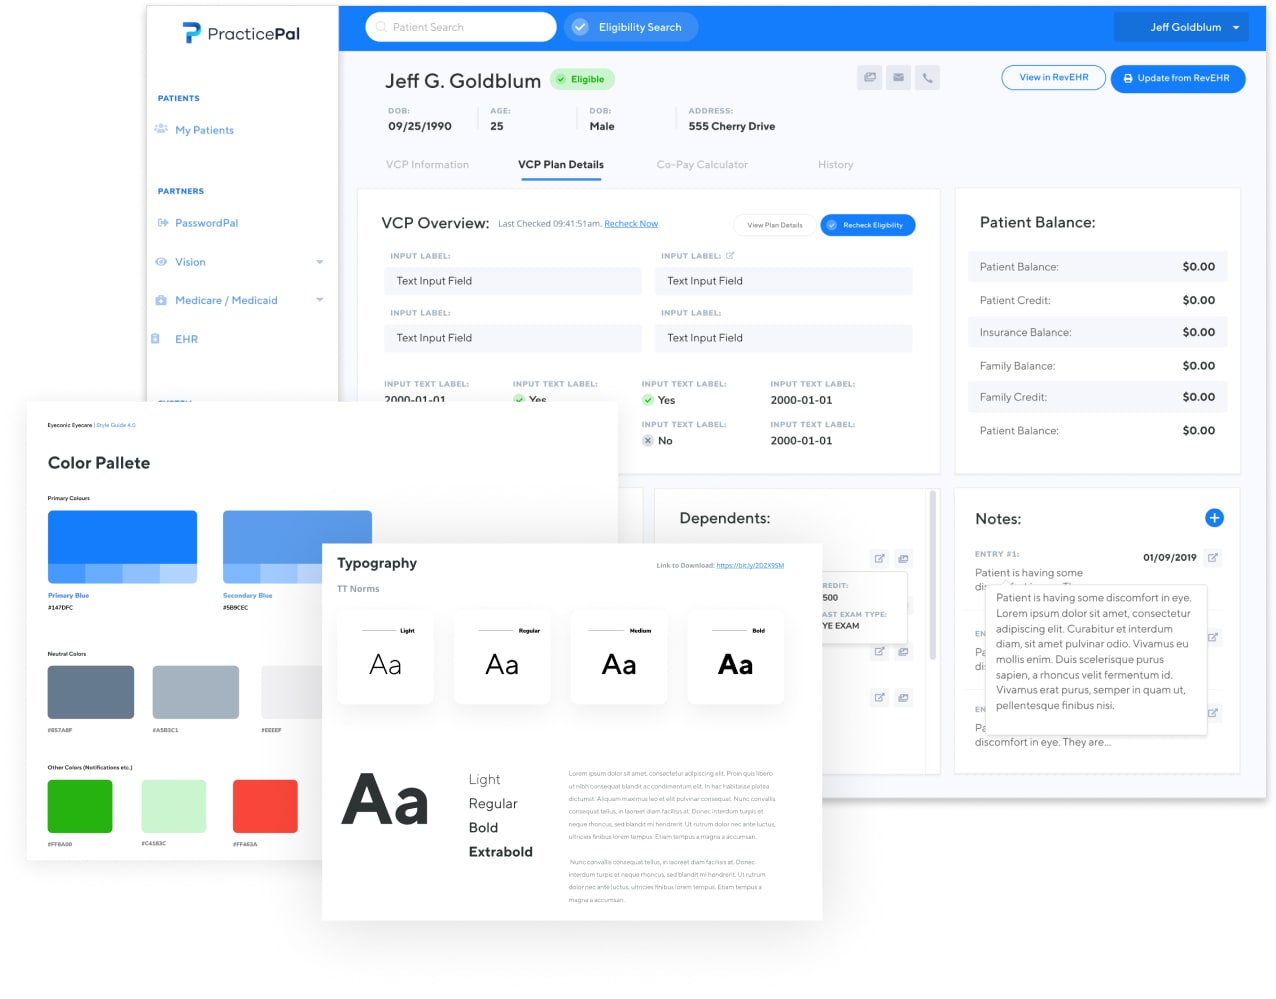
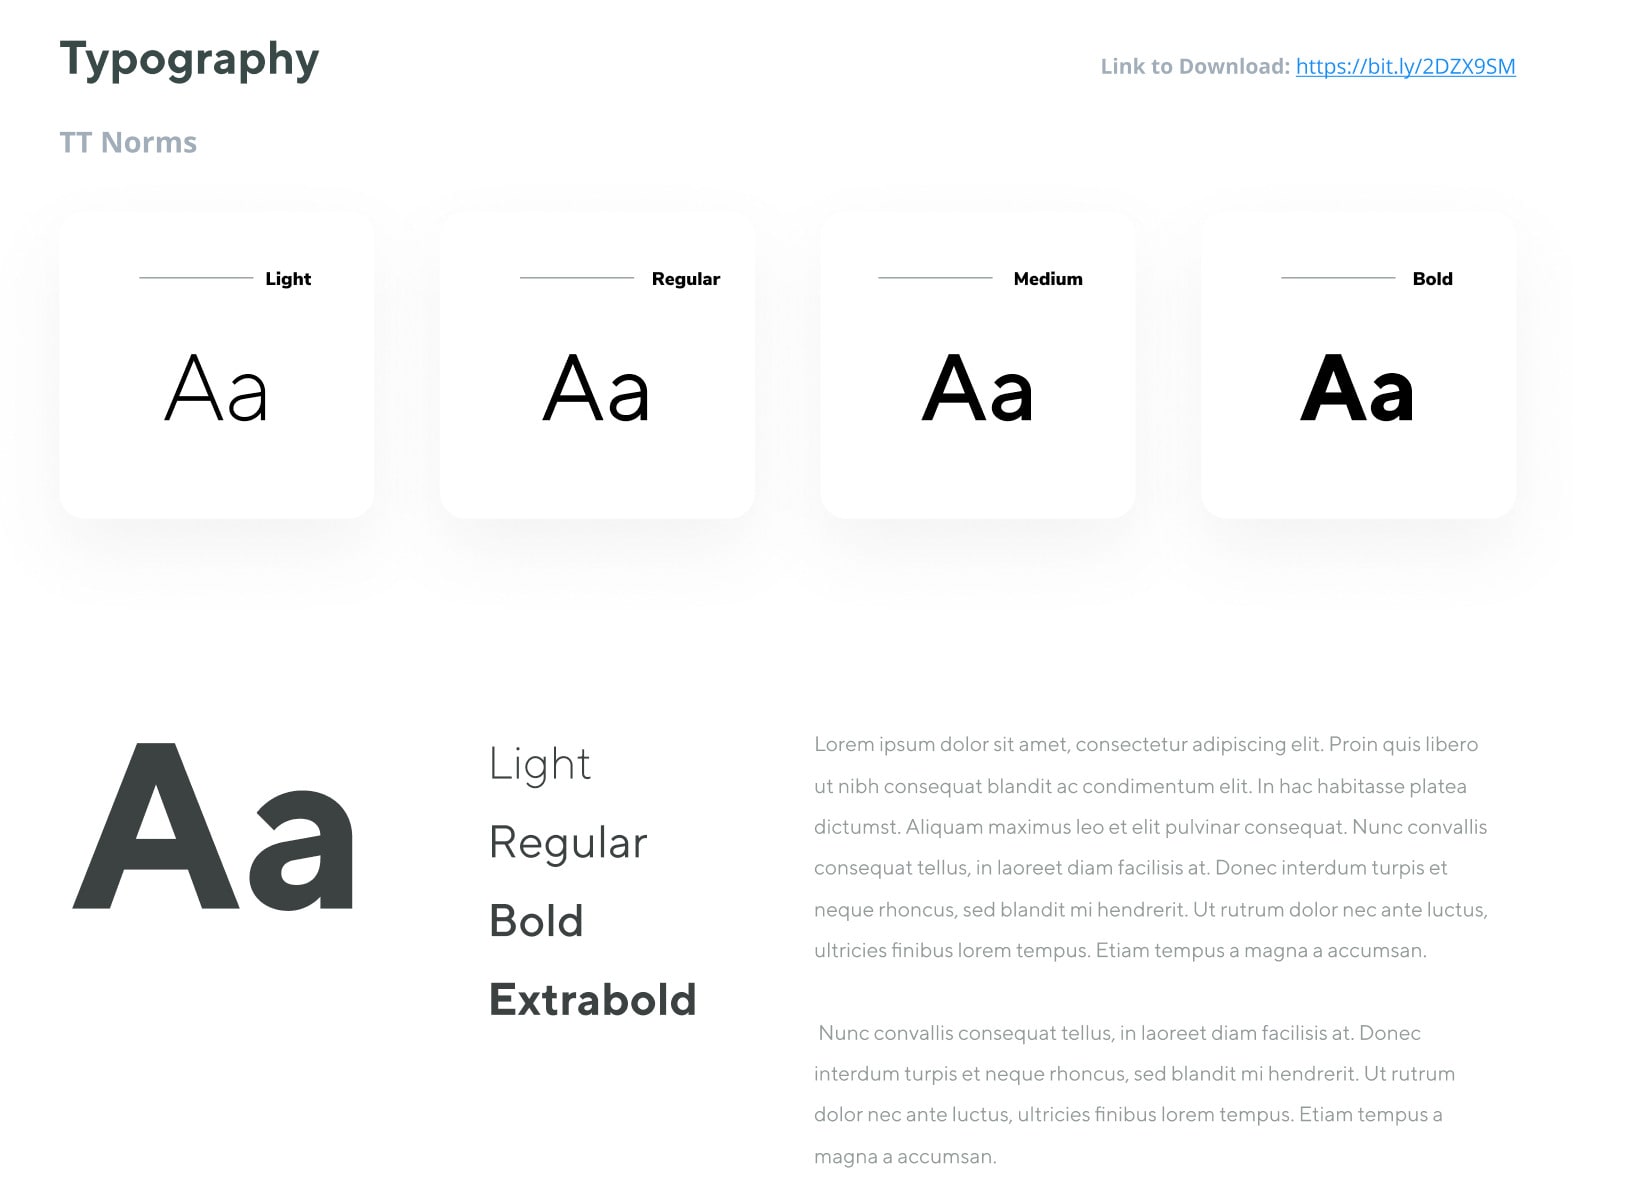
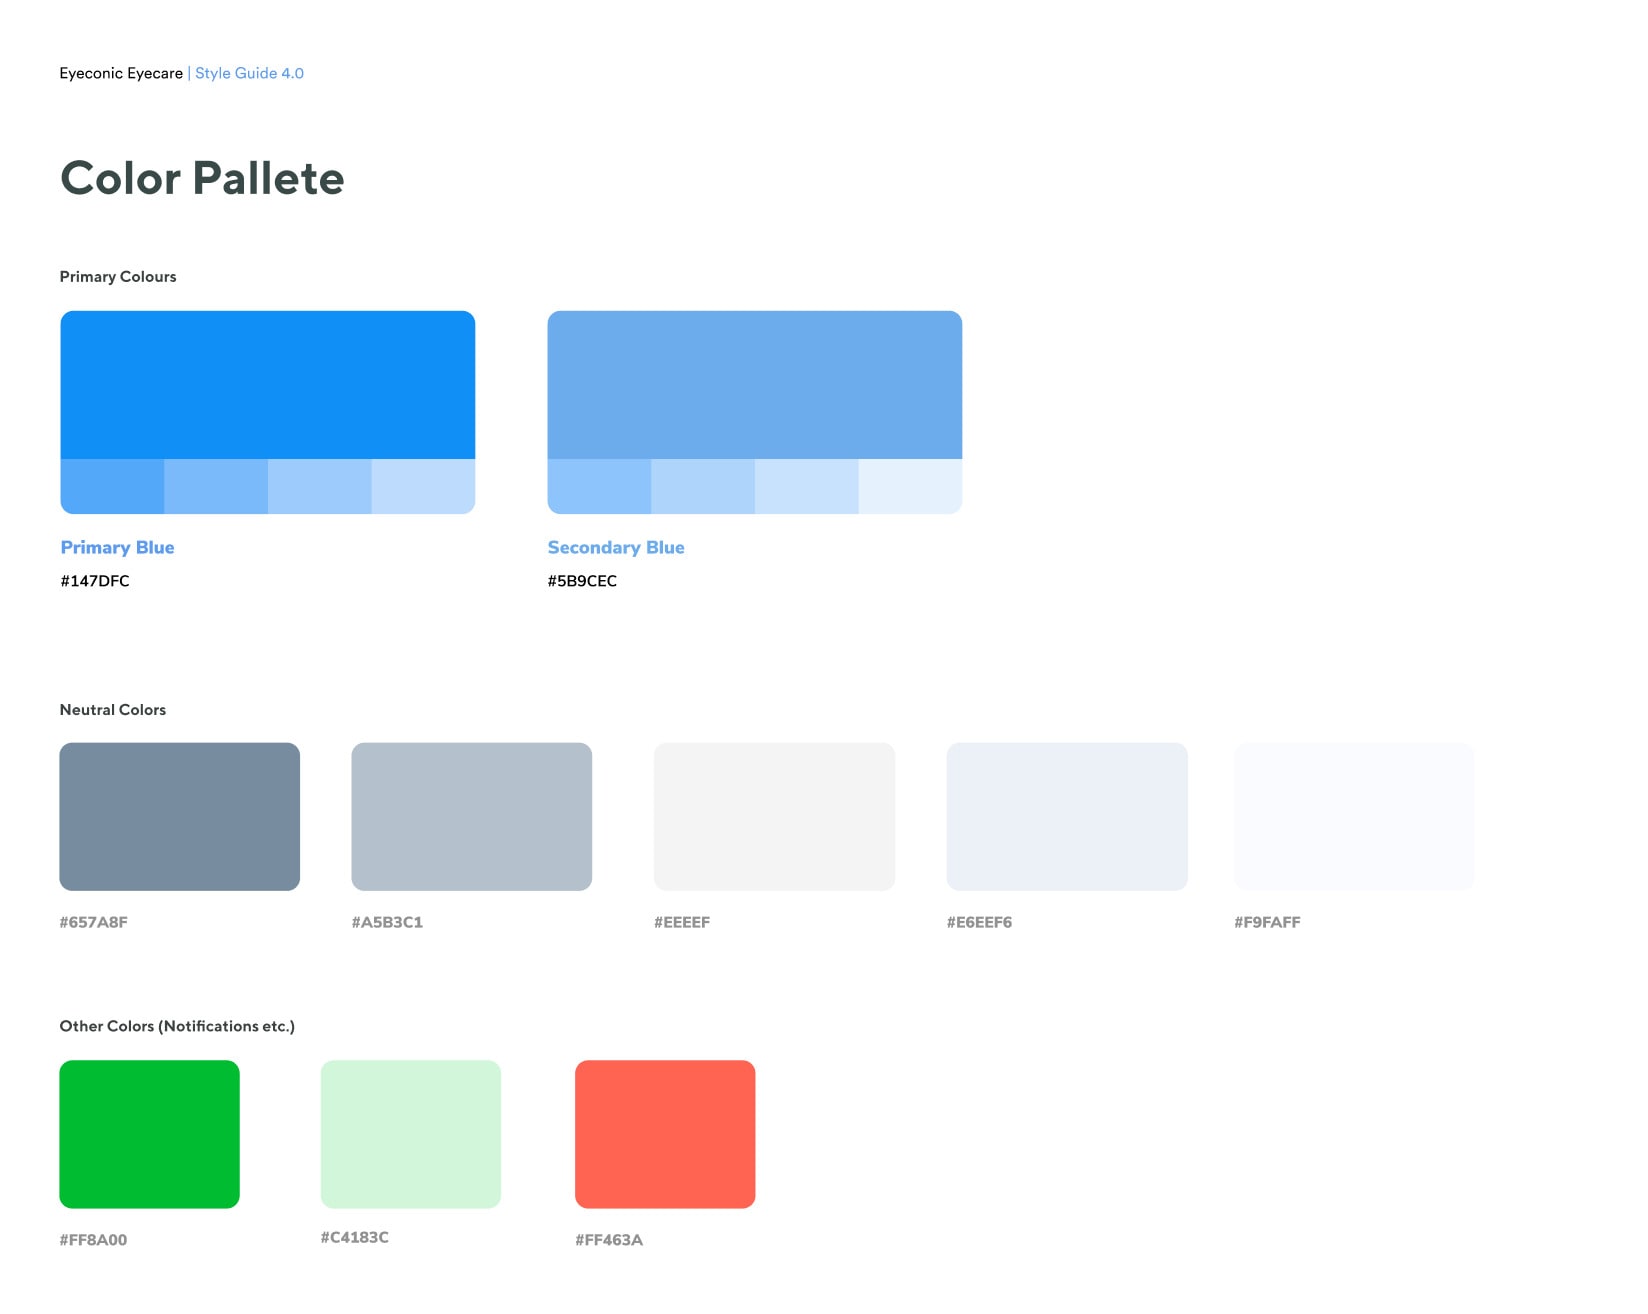
With the help of one of our talented contract designers, we worked together to define the visual style with some creative direction from myself and our lead product manager. I was able to outline and refine the specific style that we were going for, mapped to our user personas and market data to exemplify a product of high quality to meet our particular demographic.
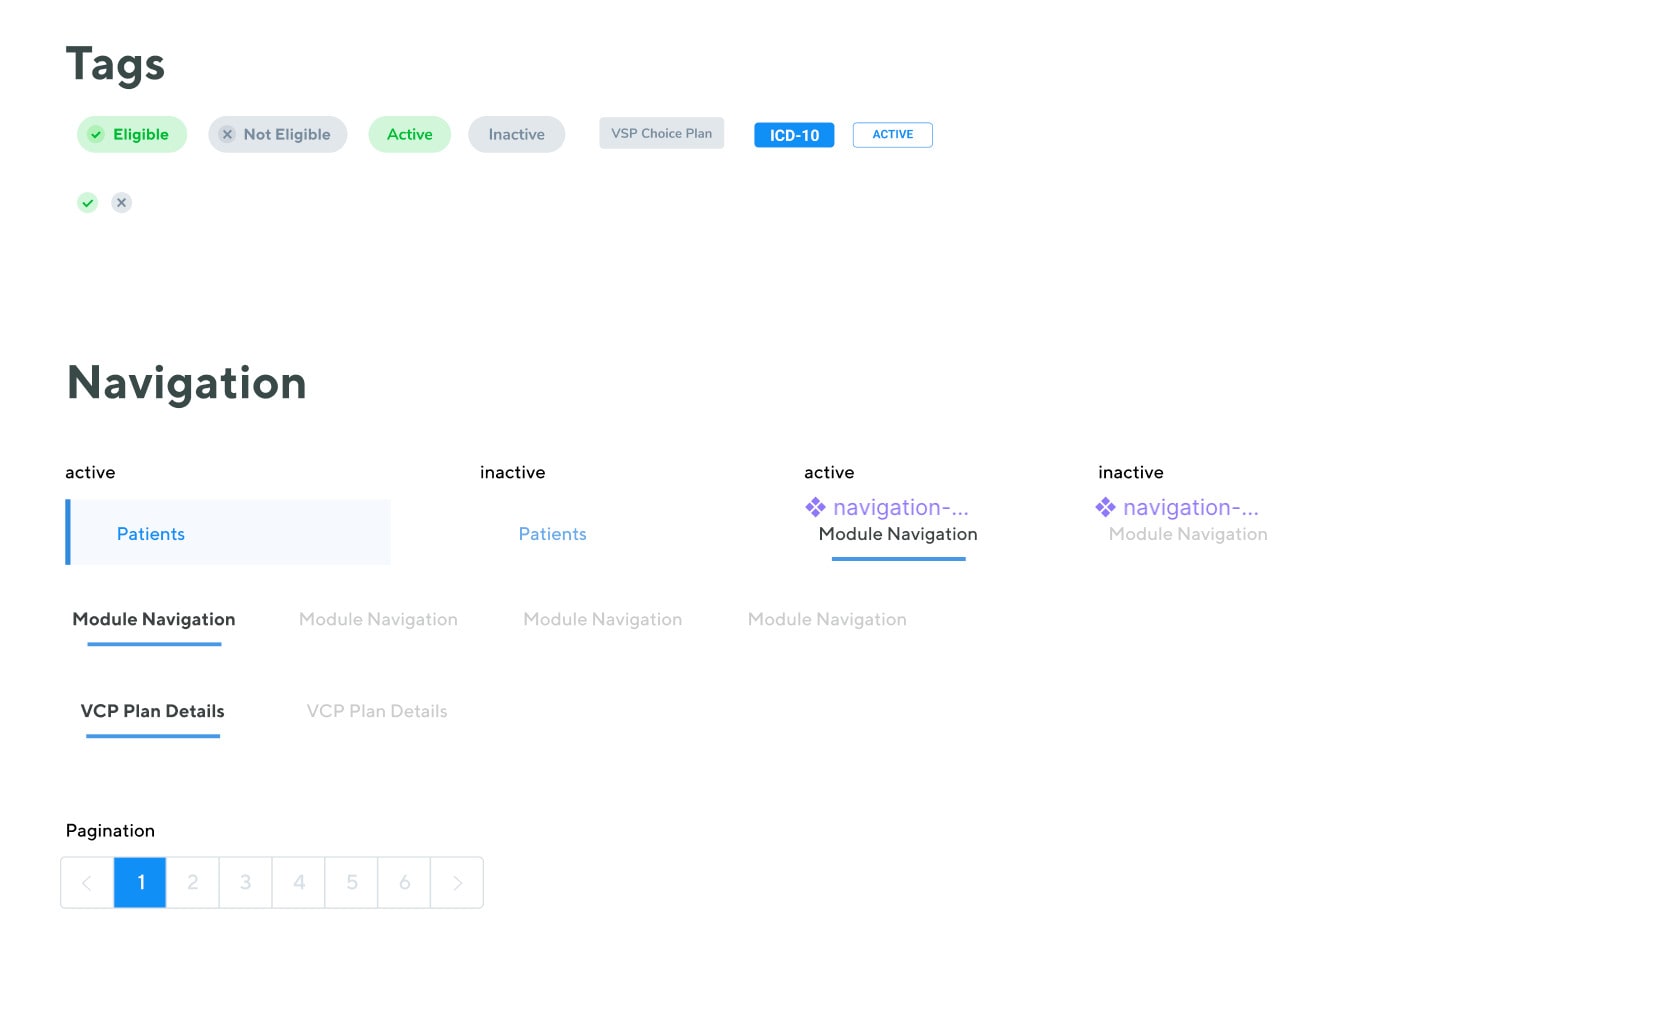
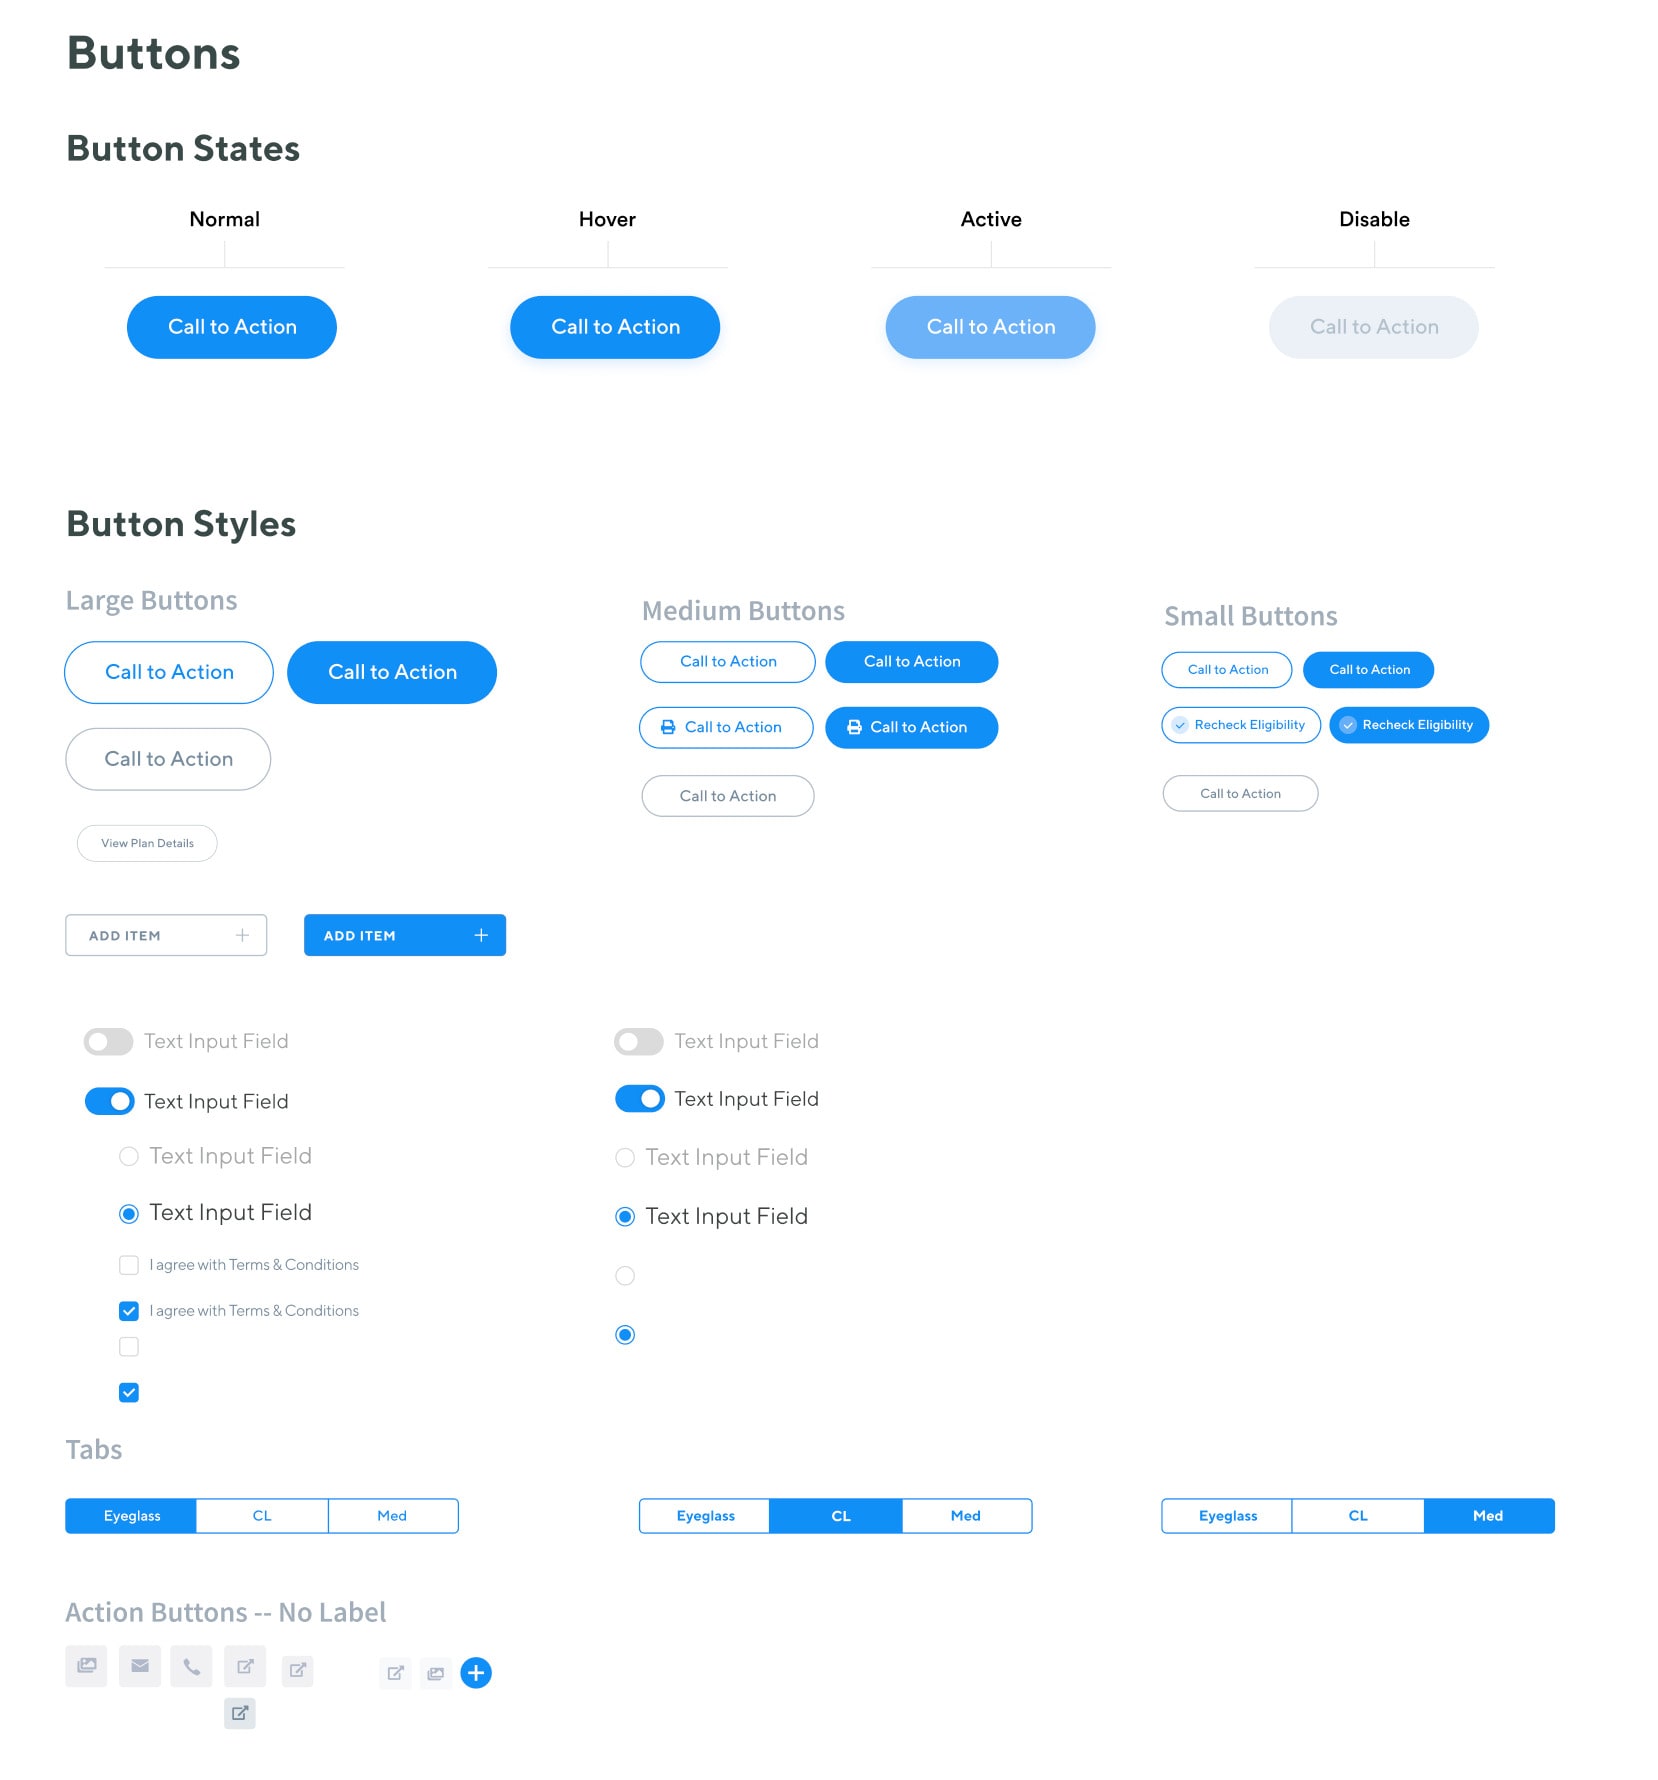
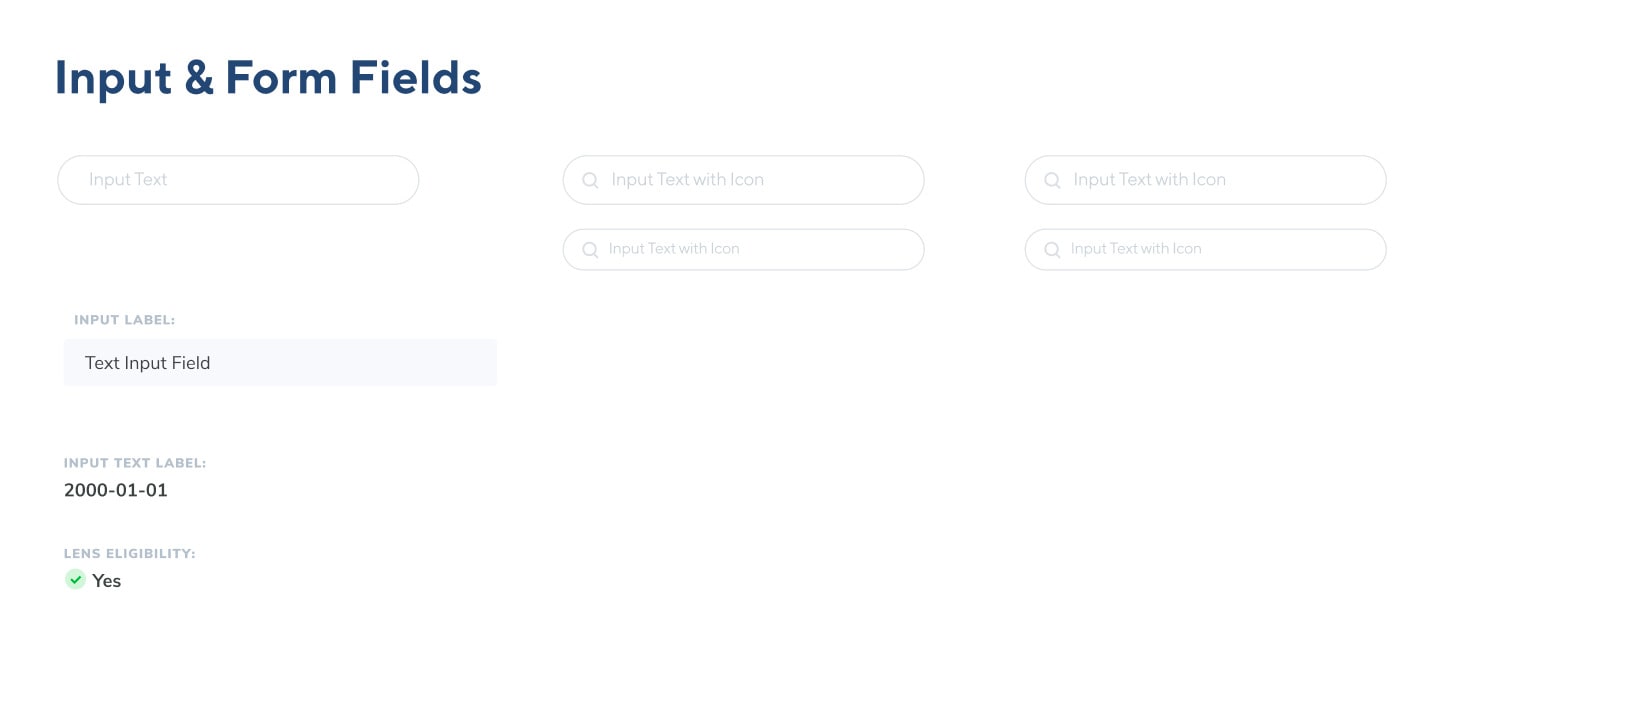
To move quickly and efficiently, we worked together to define a loose style guide, and then apply the approved style guide to a custom and unique component library that we could quickly and easily apply to our detailed wireframes. We worked closely with our React engineers to translate this component library to front-end code.
The one tool that made this incredibly easy was Figma. We were able to tag team the designs and work together to define detailed component states and reusable styles. Engineers had access to the file as we were working, with components grouped and categorized based on whether they were complete for them to begin engineering.
Once we dialed-in all of our needed components, we began apply those to our detailed wireframes.
The high-res comps we developed took a lot of fine-tuning but ultimately, the component library helped us move quicker to meet a tight timeline before an upcoming trade show to demo the product to prospective users, but also create consistency throughout the application.
testing / iteration
User Feedback
We were able to take our working demo product to a vision expo, seeking to compile user feedback using guerilla methods with a mixture of in person demos / interviews and moderated usability tests. This was an incredibly valuable event to both capture useful feedback on how users interacted with our software, but also the excitement of the toolset we are providing.
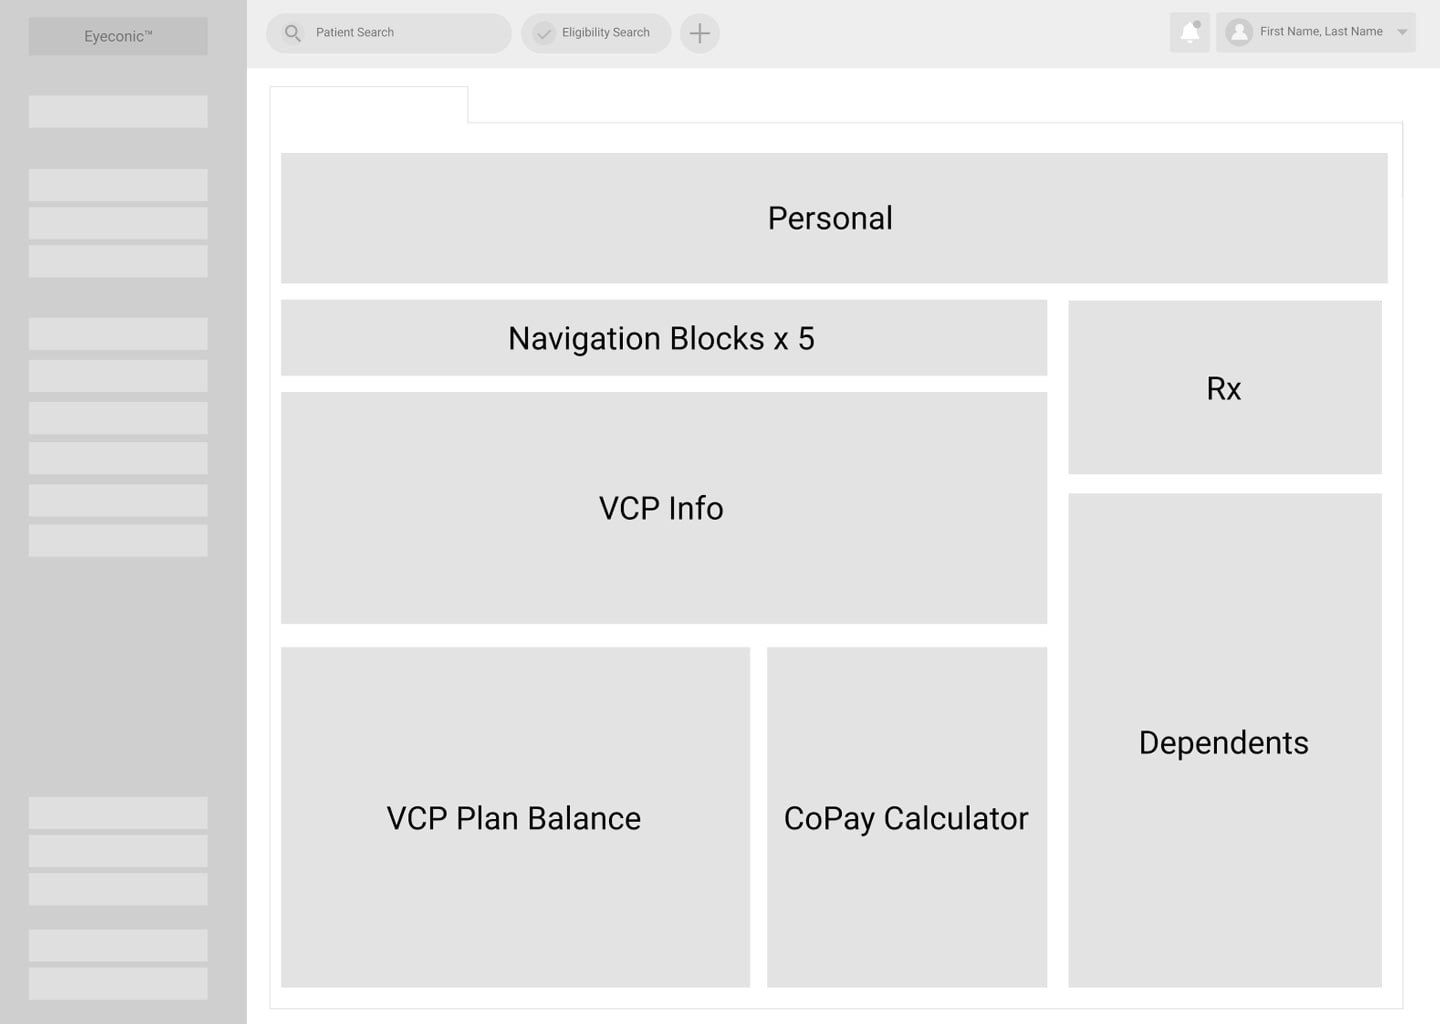
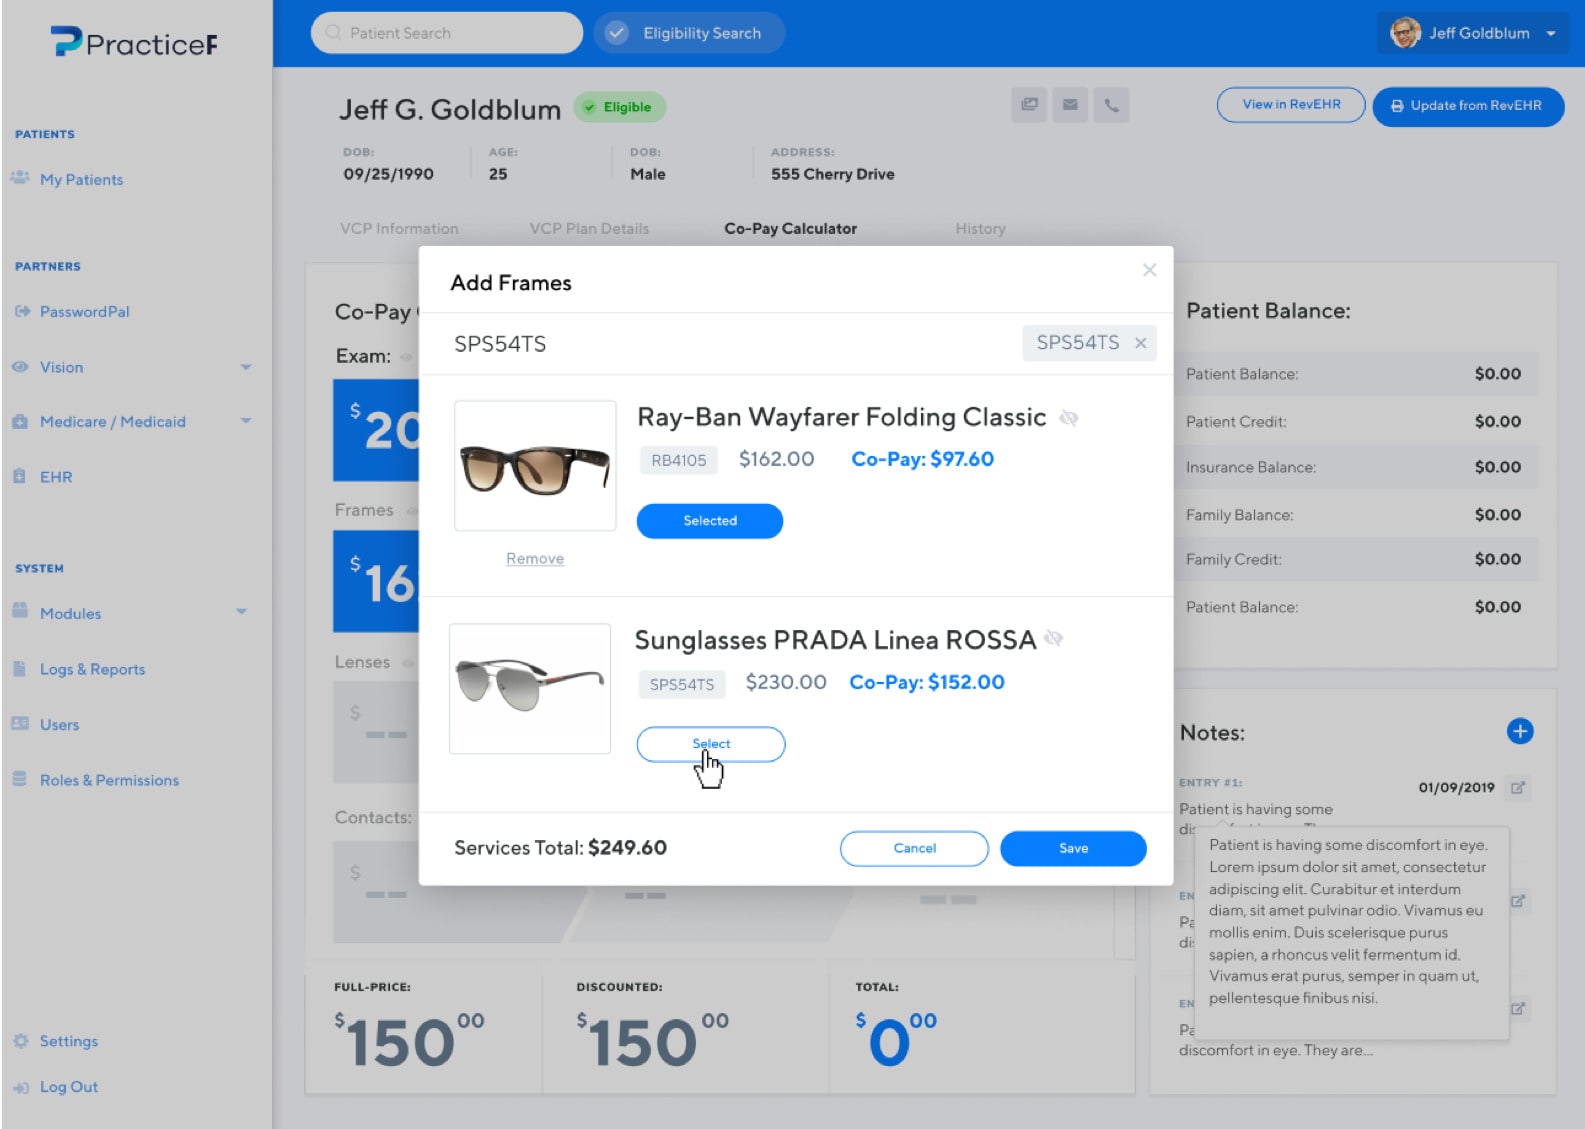
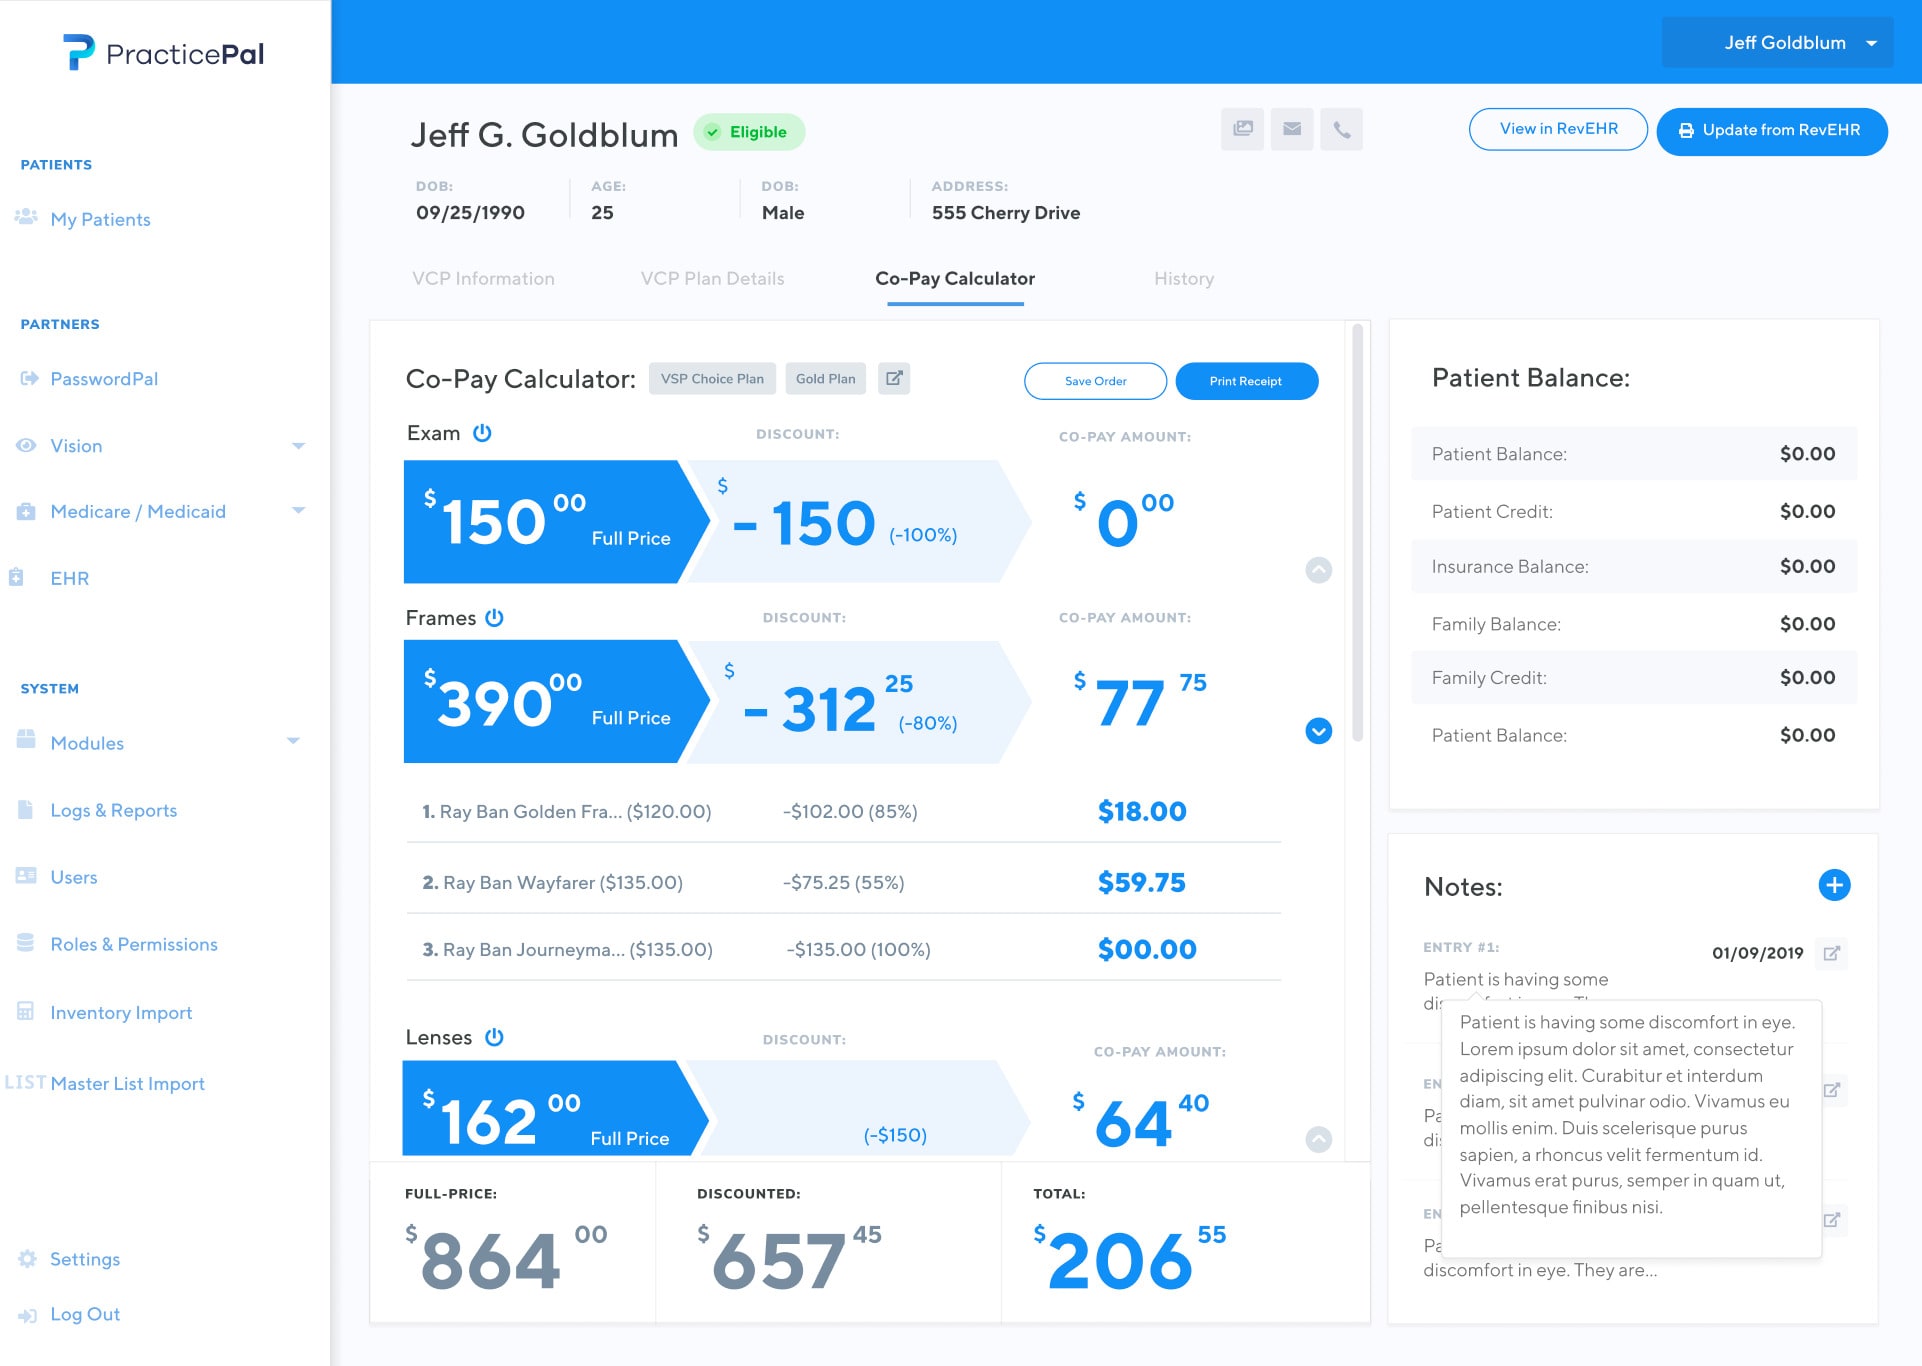
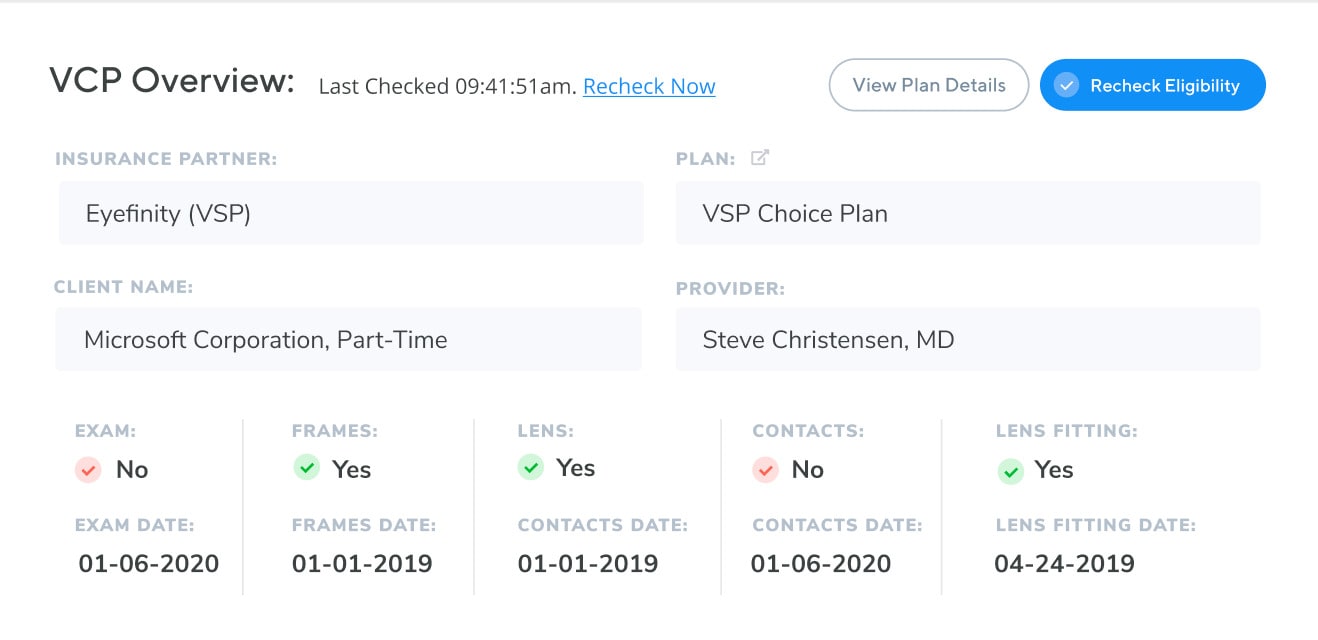
To our surprise, the most popular feature during this expo was the co-pay calculator. The co-pay calculator, once just an after thought and secondary feature of the app, became the primary focus of the application moving forward. We spent several iterations making sure this mobile, on-demand co-pay calculation tool was the focal point of our software.
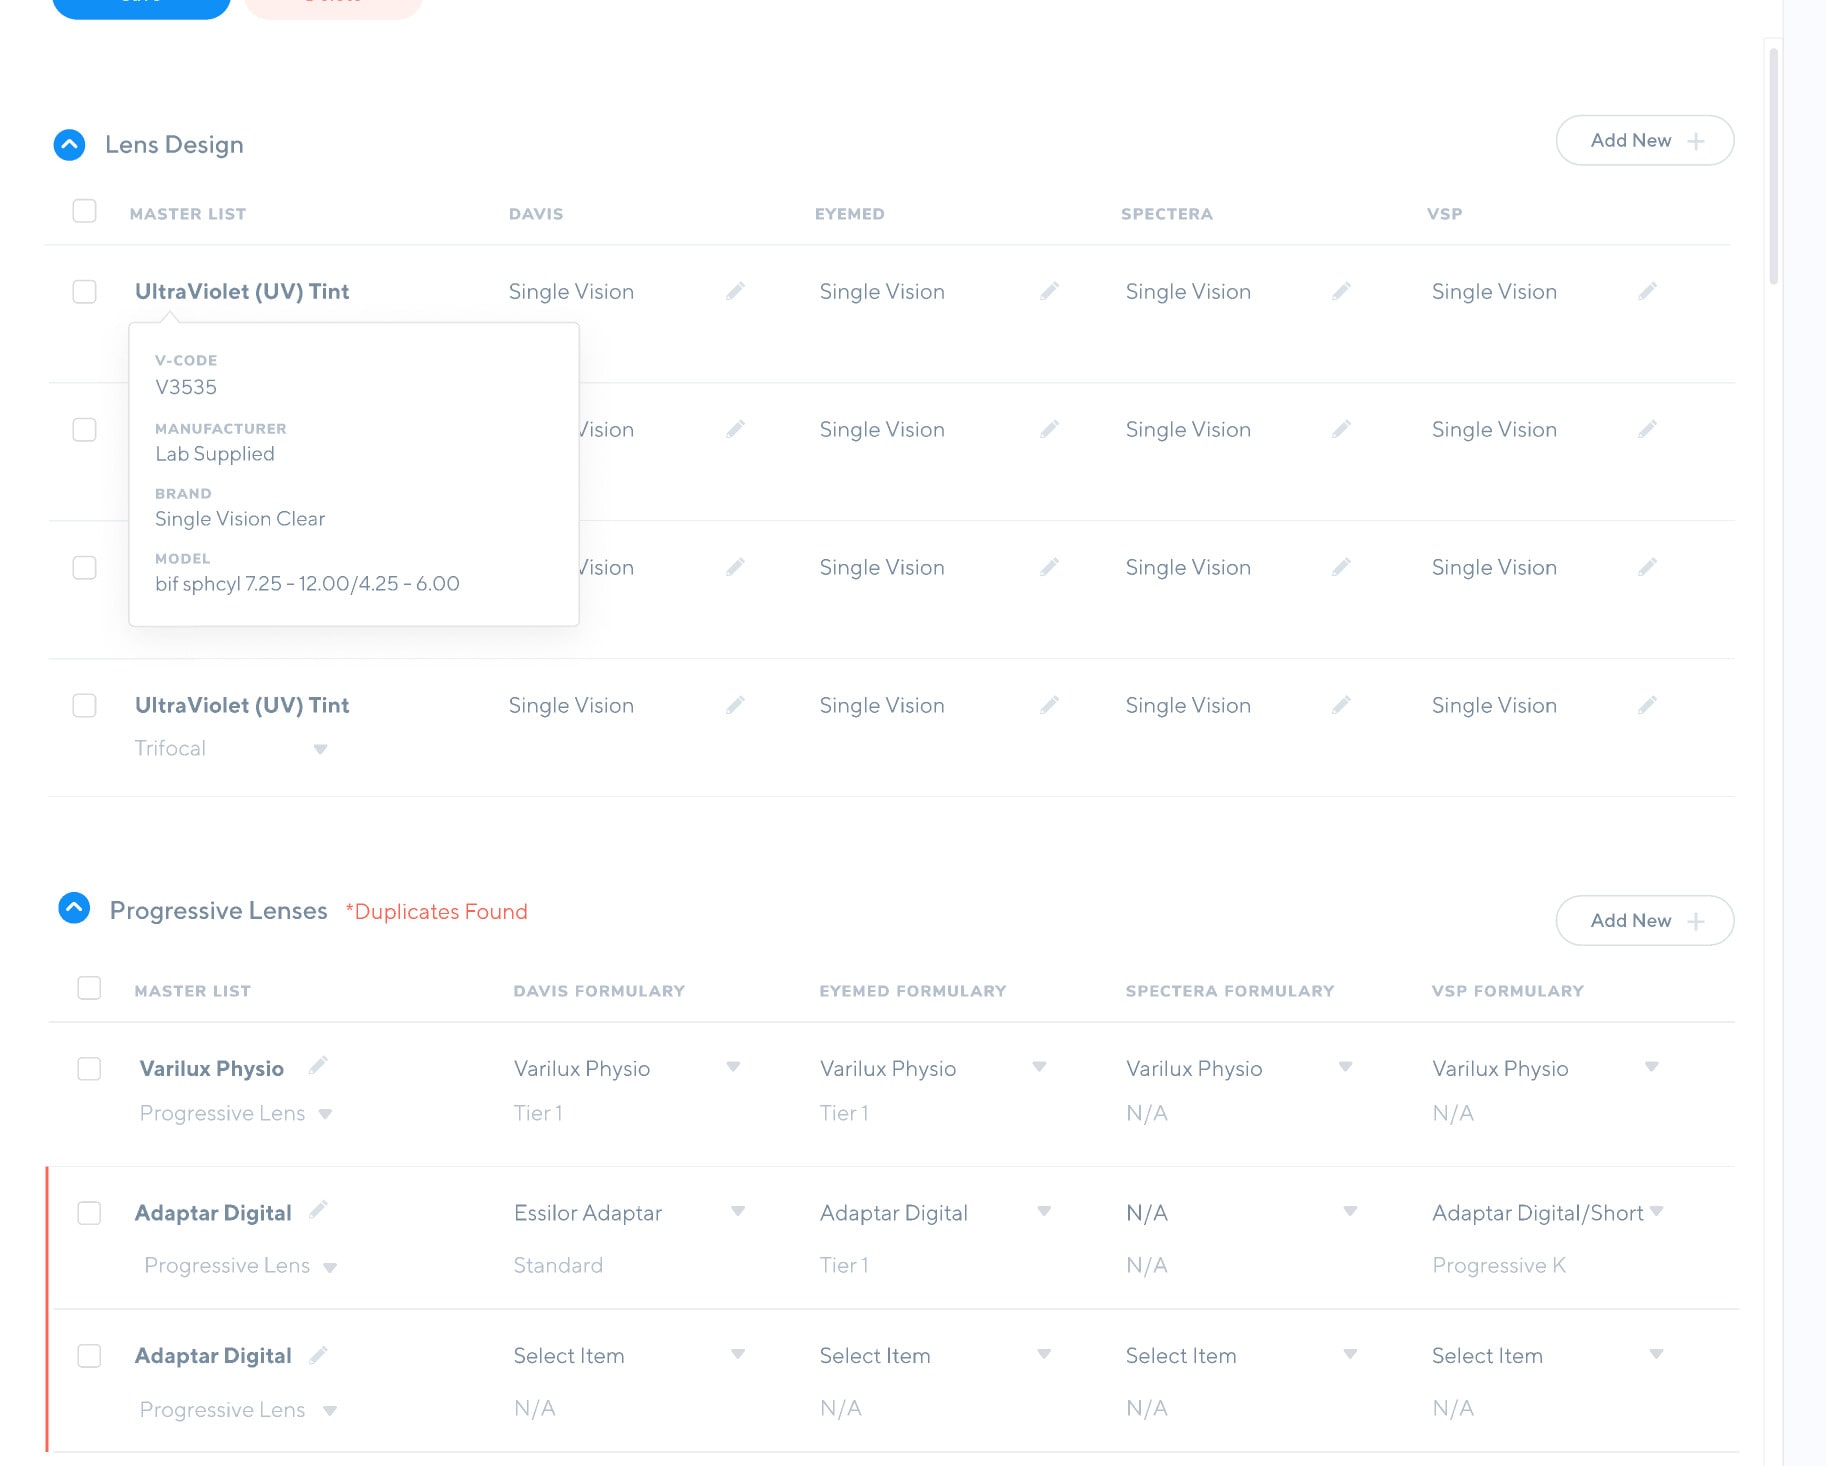
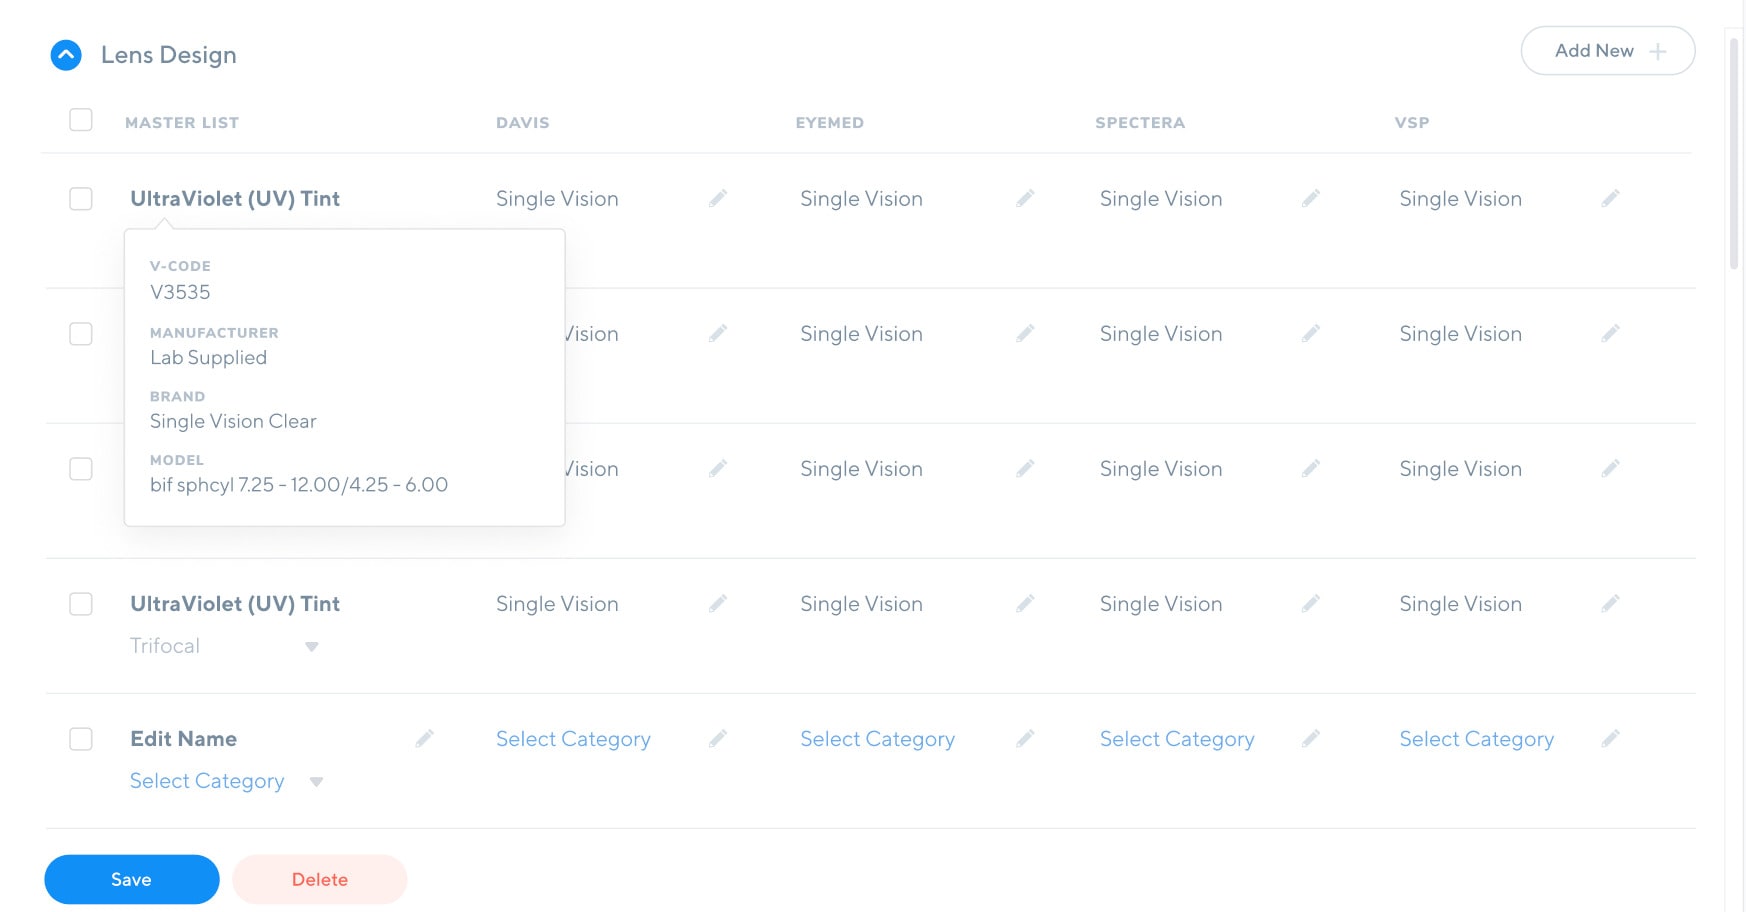
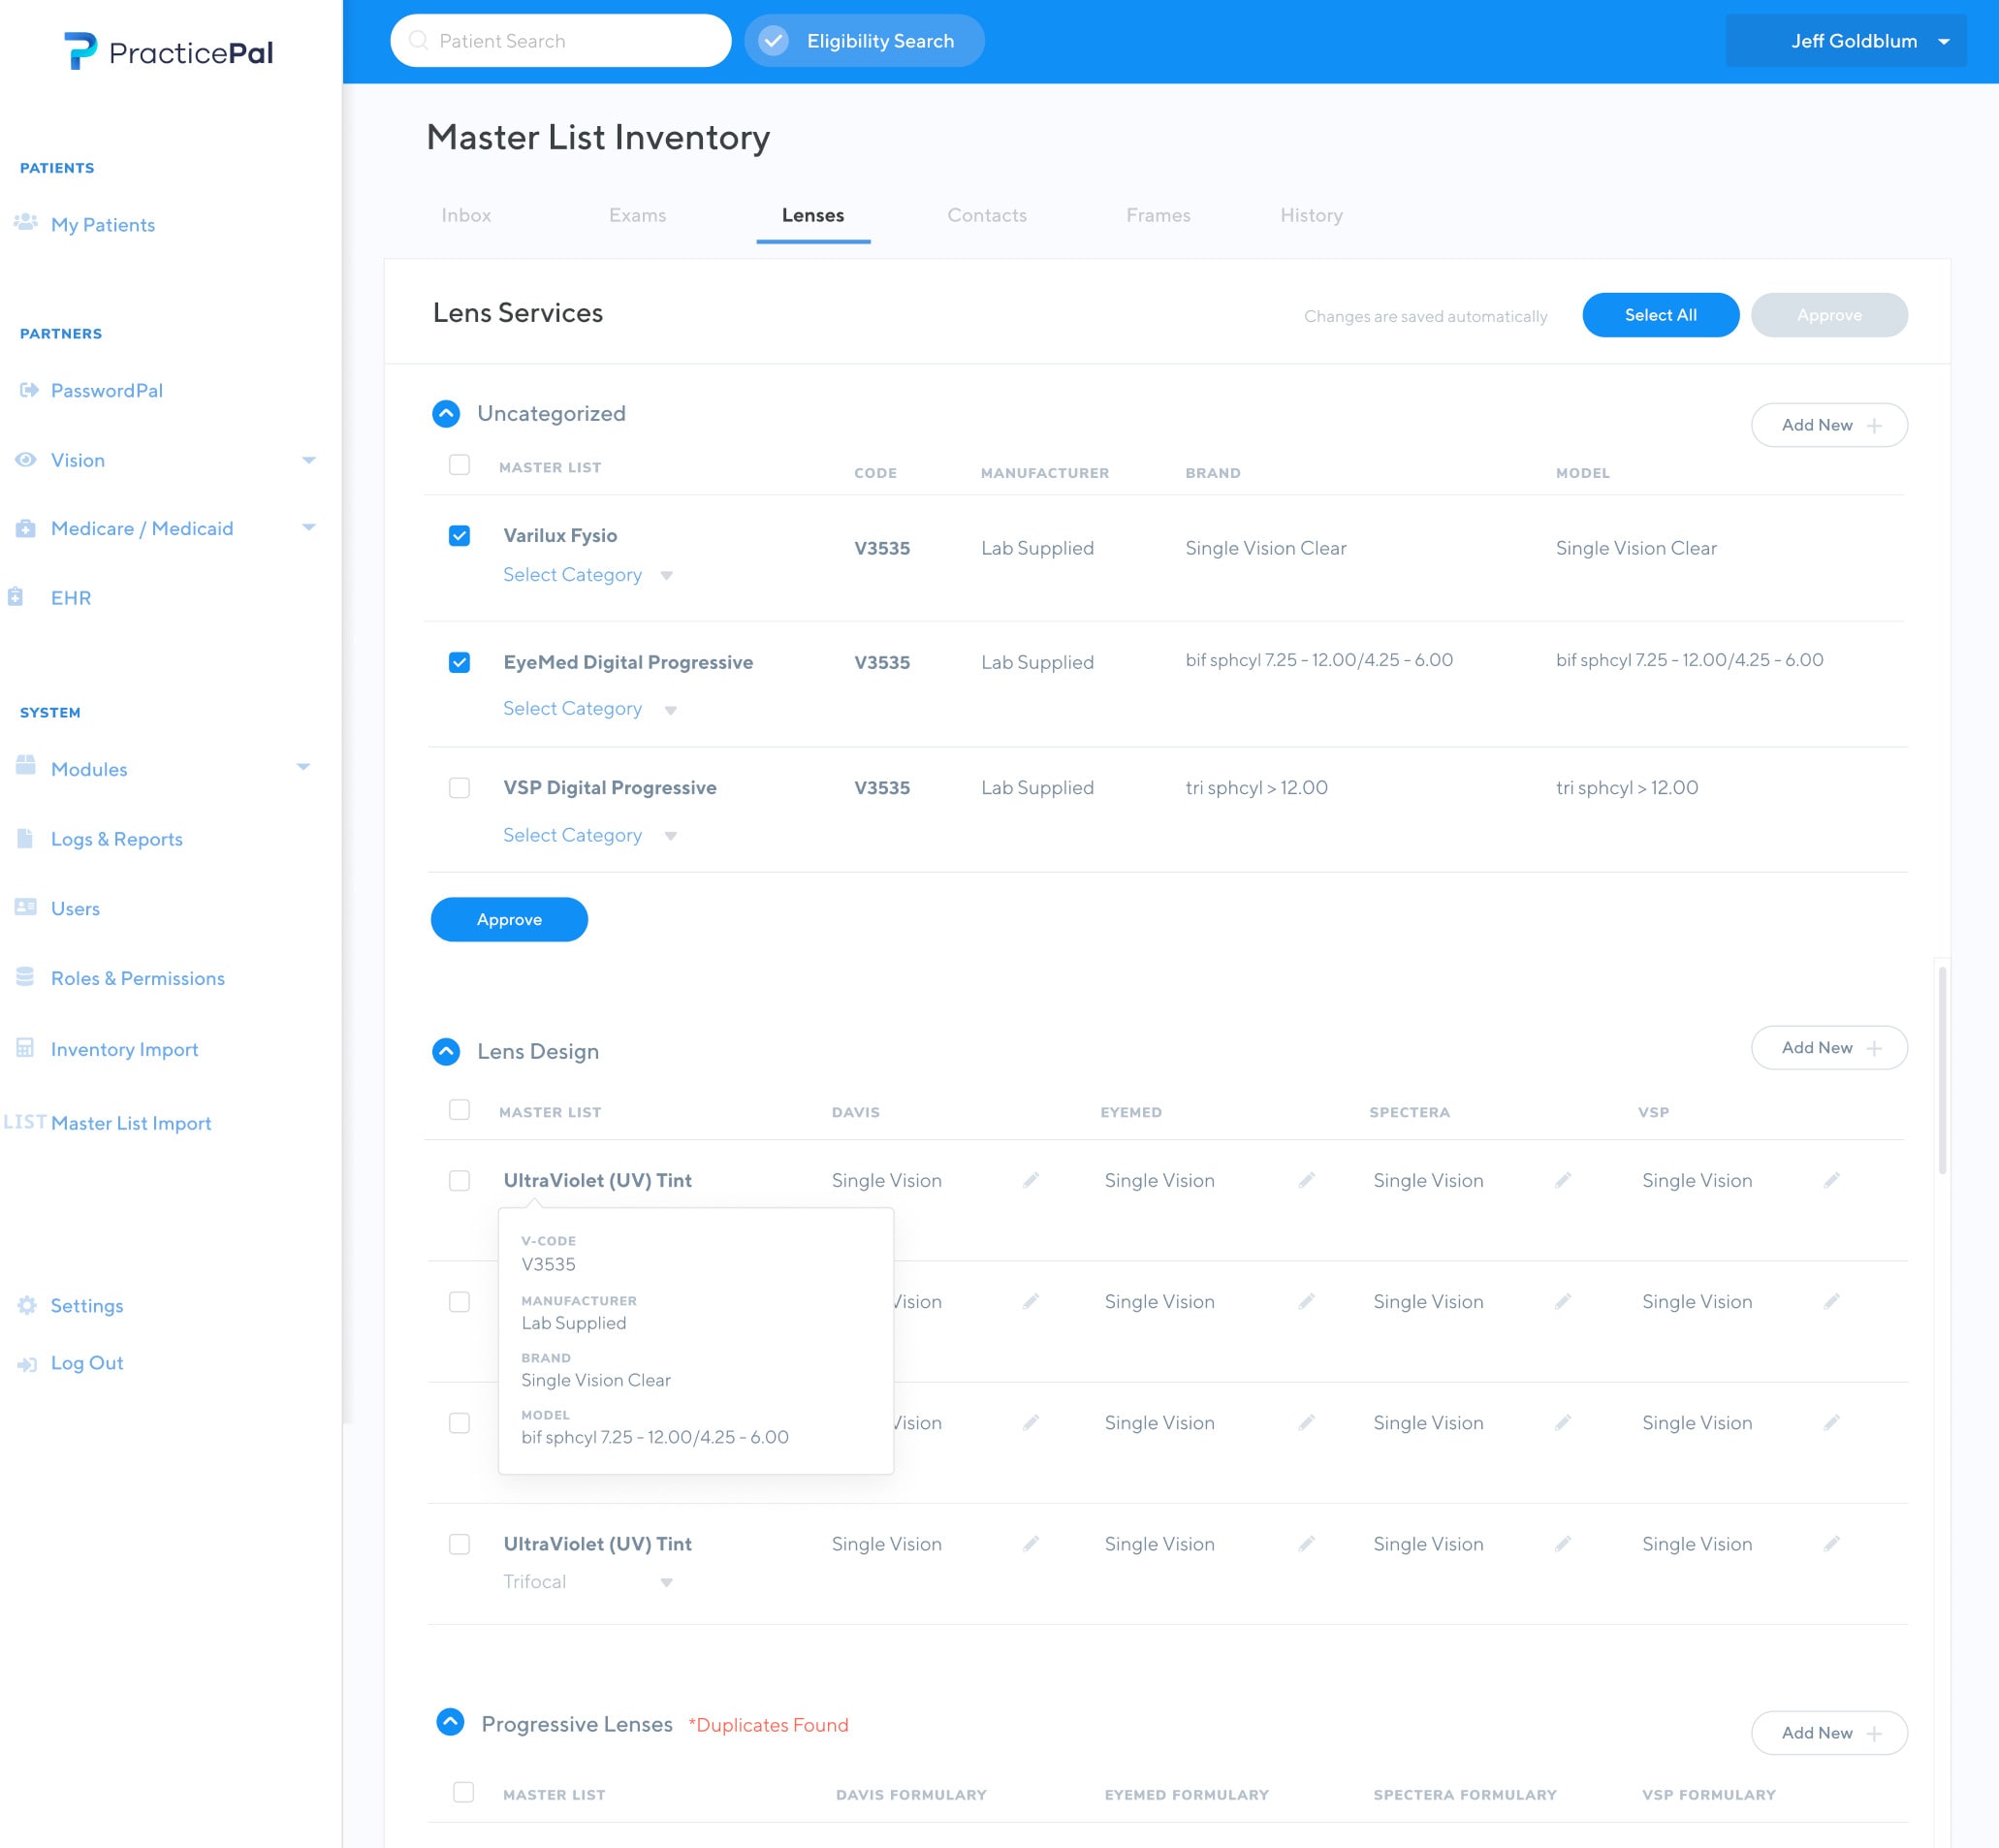
The co-pay calculation tool can determine patient co-pay amounts by determining the patient’s insurance, factoring in what type of frames, contacts, lenses, and exams, factoring in any discounts, prior insurance used throughout the year, and other dependencies that are typically calculated painstakingly by hand.
The applications of this co-pay calculation tool could be applied to areas beyond optometry. Our users told us and we had gathered that this tool could be used across any medical, dental or vision practice across the country. This process of calculating co-pay amounts is time-consuming and error-prone.
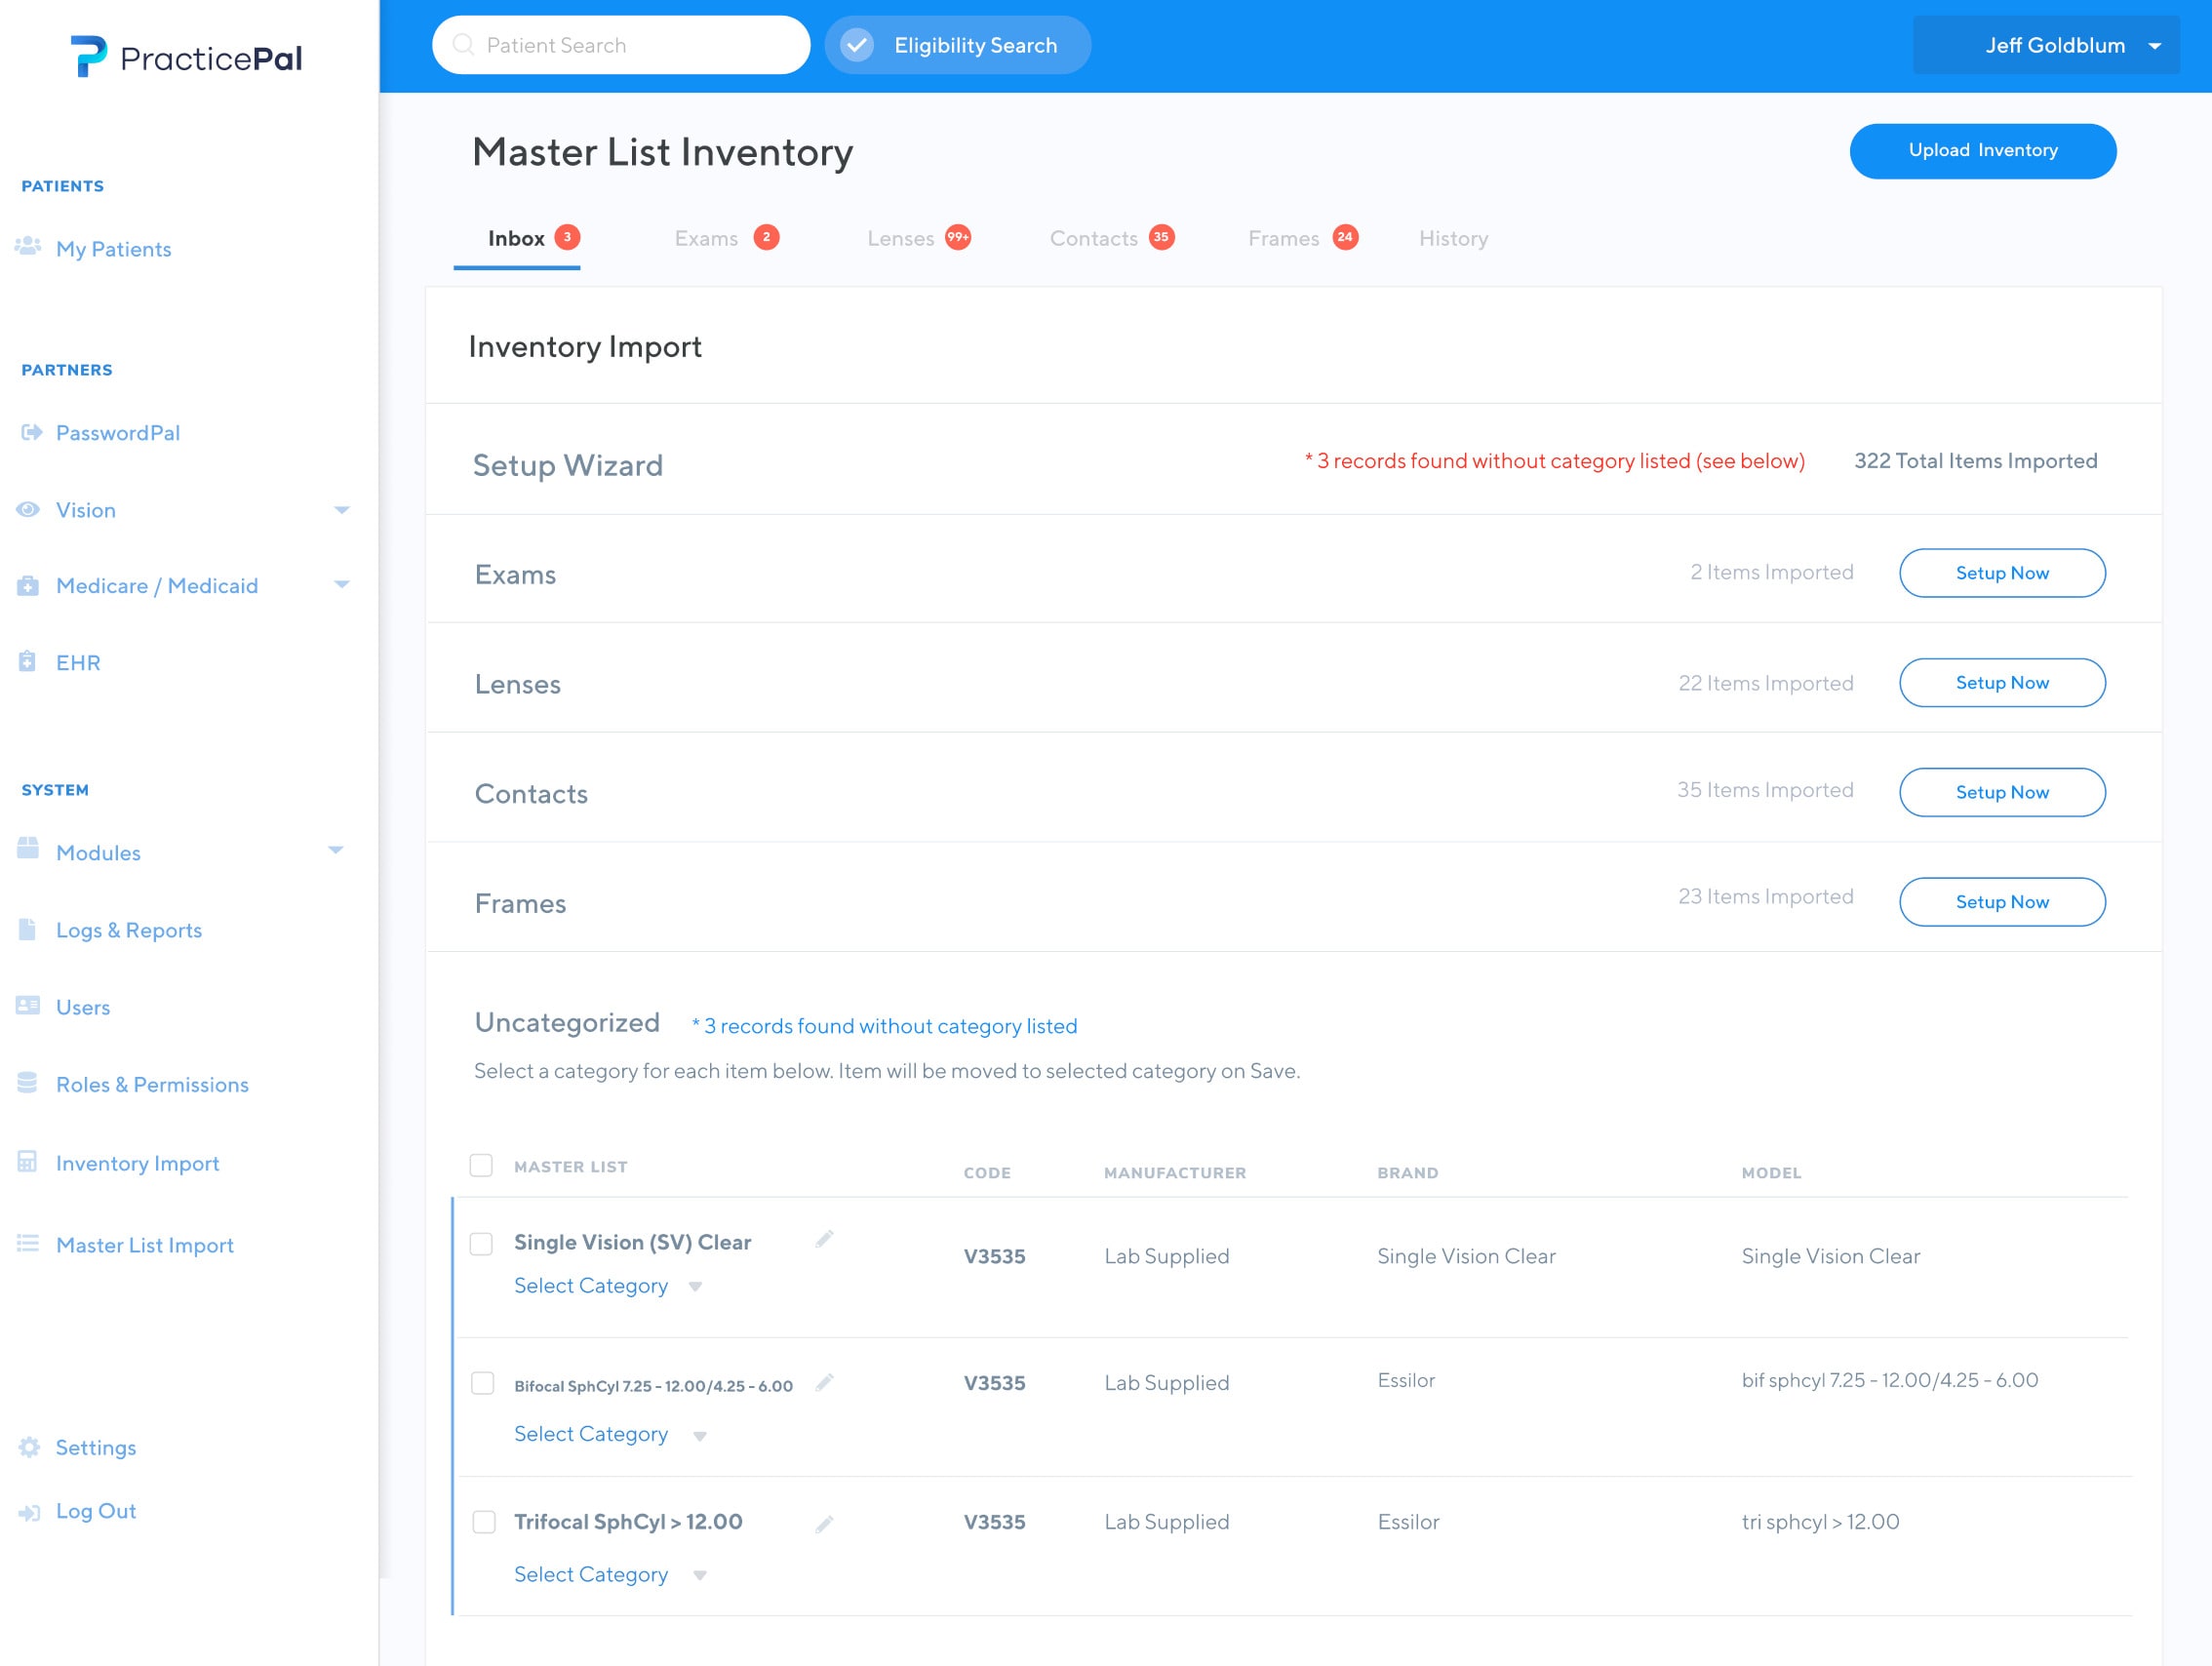
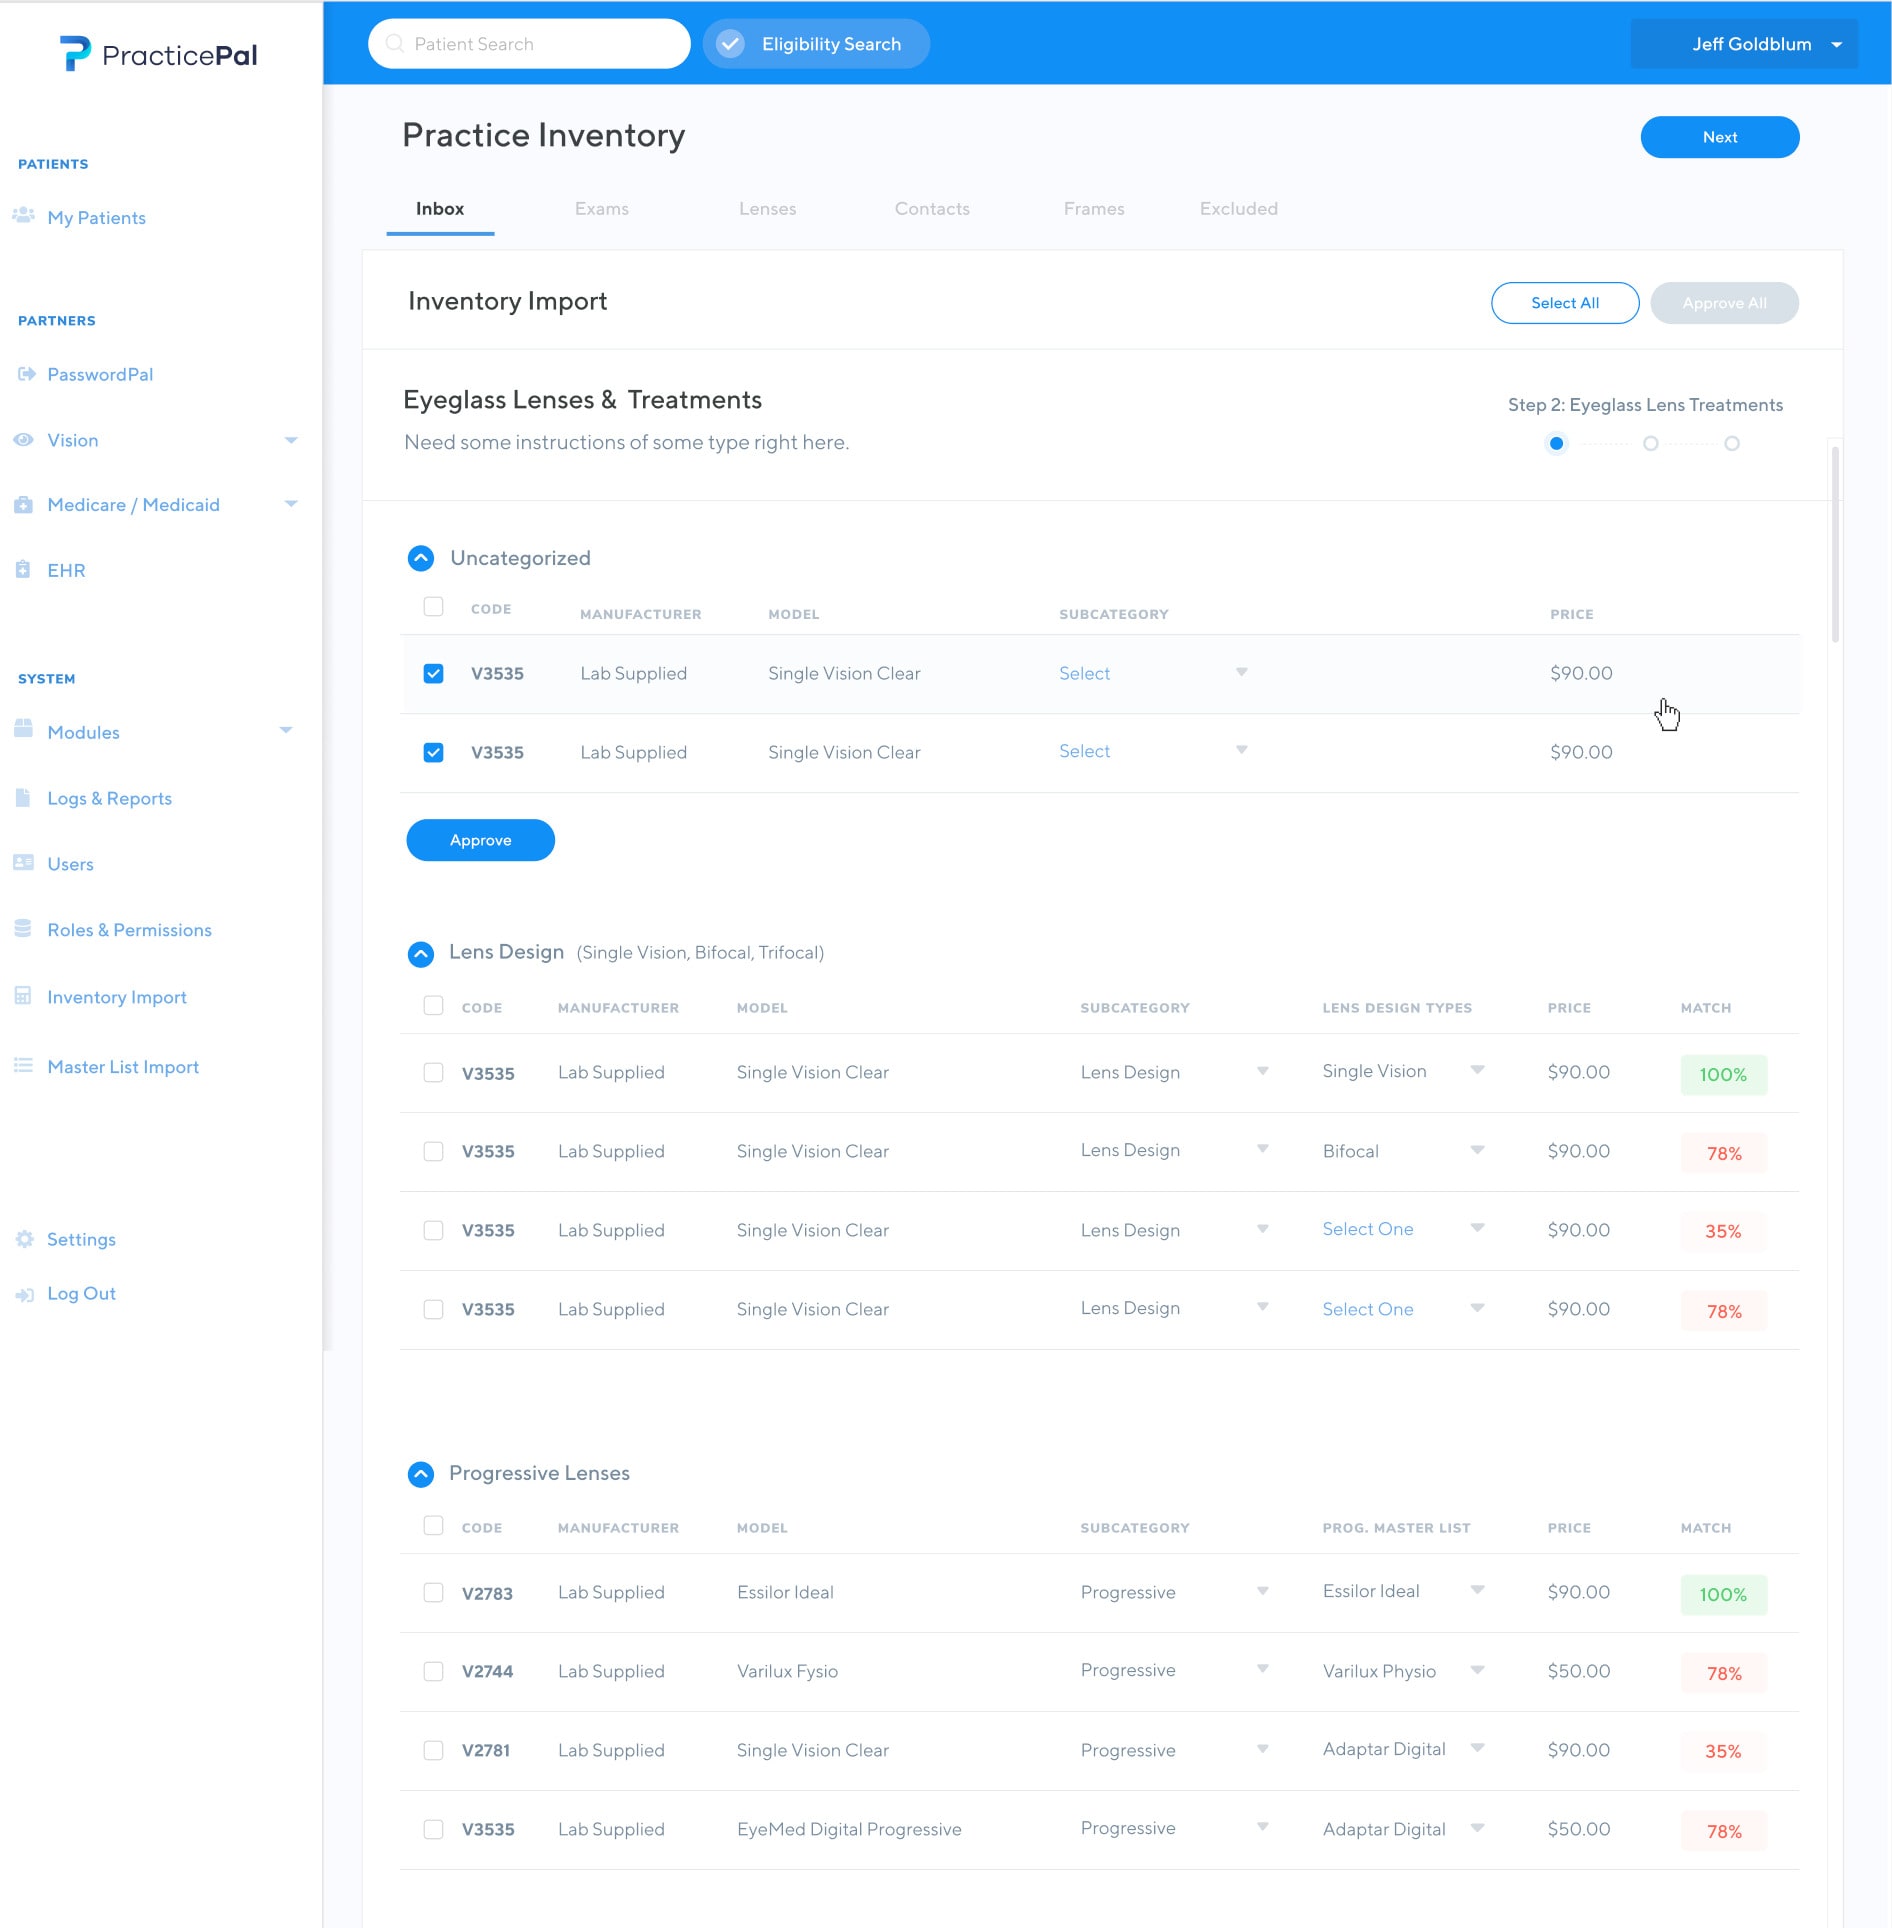
This tool was a complex process, requiring us to map individual insurance plan details to existing practice inventory. It was our job to figure out how to scrape this available data.
wrap up
Concluding Thoughts
The reception of the product was well received by the eyecare and healthcare community. The team continues to iterate on the product in my absence. It was an incredible team effort and wouldn’t be possible without the hard work, dedication and determine our team exemplified.
What's Next
If you'd like to chat about an upcoming project or just want nerd out on the latest design technologies, drop me a at [email protected]. I'm currently AVAILABLE for research and strategy, user experience, user interface design, and product management opportunities. Let's build something incredible.